Question
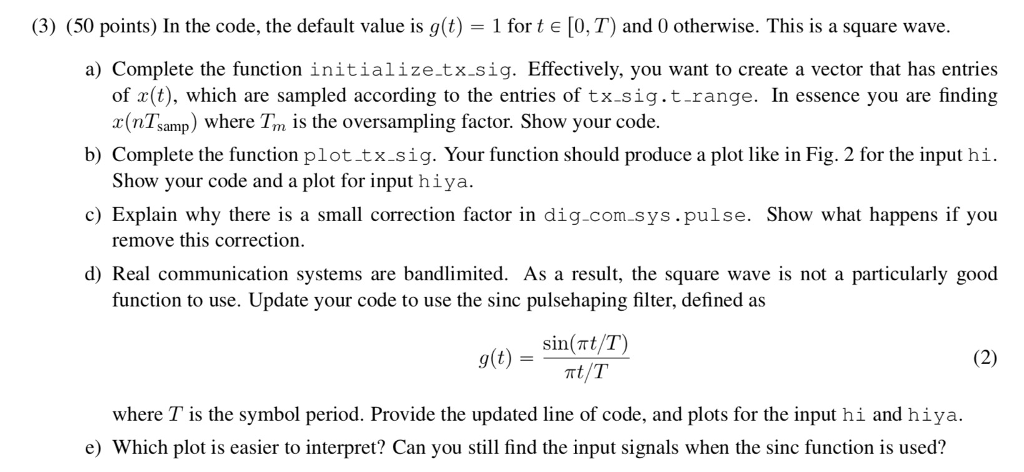
MATLAB Code: function dig_com_sys = initialize_dig_com_system(varargin) %function dig_com_sys = initialize_dig_com_system(varargin) % % Initializes the digital communication system structure. This structure % contains the key parameters


MATLAB Code:
function dig_com_sys = initialize_dig_com_system(varargin) %function dig_com_sys = initialize_dig_com_system(varargin) % % Initializes the digital communication system structure. This structure % contains the key parameters of the system. We package them in a structure % so we do not have to send them around separately. Default takes no inputs, optionally can change defaults. % % The output structure defines several fields % % dig_com_sys.const is the text name of the constellation % dig_com_sys.C constellation, order corresponds to binary mapping % dig_com_sys.M size of the constellation % dig_com_sys.R rate in terms of bits per symbol % dig_com_sys.T symbol period in seconds % dig_com_sys.M_over integer oversampling factor % dig_com_sys.T_samp sample period in seconds % dig_com_sys.pulse anonymous function that creates the pulse shape % (probably not best way to do this) % dig_com_sys.C_label = binary constellation labeling %
dig_com_sys.const = '4PAM'; % text name of the constellation dig_com_sys.C = [-3/2, -1/2, 1/2, 3/2]; % constellation, order corresponds to binary mapping dig_com_sys.T = 0.001; % symbol period in seconds dig_com_sys.M_over = 10; % integer oversampling factor %dig_com_sys.pulse = @(x) double((x>=0) & (x
%%%%%%%%%%%
function tx_sig = initialize_tx_sig(dig_com_sys) % function tx_sig = initialize_tx_sig(dig_com_sys) % % Function that creates the transmitted waveform for PAM. Essentially % oversamples the function x(t) = \sum_n s[n] g(t-nT) according to the % oversample rate. The message is obtained by asking the user to input a % string. This can be replaced with a fixed message for debugging purposes. % % tx_sig.symbols vector of symbols % tx_sig.N_sym number of symbols % tx_sig.t_range sample of the waveform from -2 T to (N_sym+1) T % tx_sig.x vector of oversampled waveform x(t) = \sum_n s[n] g(t-nT) %
tx_sig.message = input('What text would you like to send? ','s'); % Convert the message to bits bits_temp = dec2bin(tx_sig.message, 8); % convert the characters to an array of bits
% Convert the bits to symbols [num_chars, bits_per_char] = size(bits_temp); bits_per_symbol = reshape(bits_temp,num_chars*bits_per_char/dig_com_sys.R, dig_com_sys.R); symbol_index = bin2dec(bits_per_symbol) + 1; tx_sig.symbols = dig_com_sys.C(symbol_index); tx_sig.symbols = tx_sig.symbols(:); tx_sig.N_sym = length(tx_sig.symbols); tx_sig.t_range = dig_com_sys.T*[-2:1/dig_com_sys.M_over:(tx_sig.N_sym+1)]'; % Create a vector of pulse shaped symbols
%tx_sig.x holds result end
%%%%%%%%%%%%%%
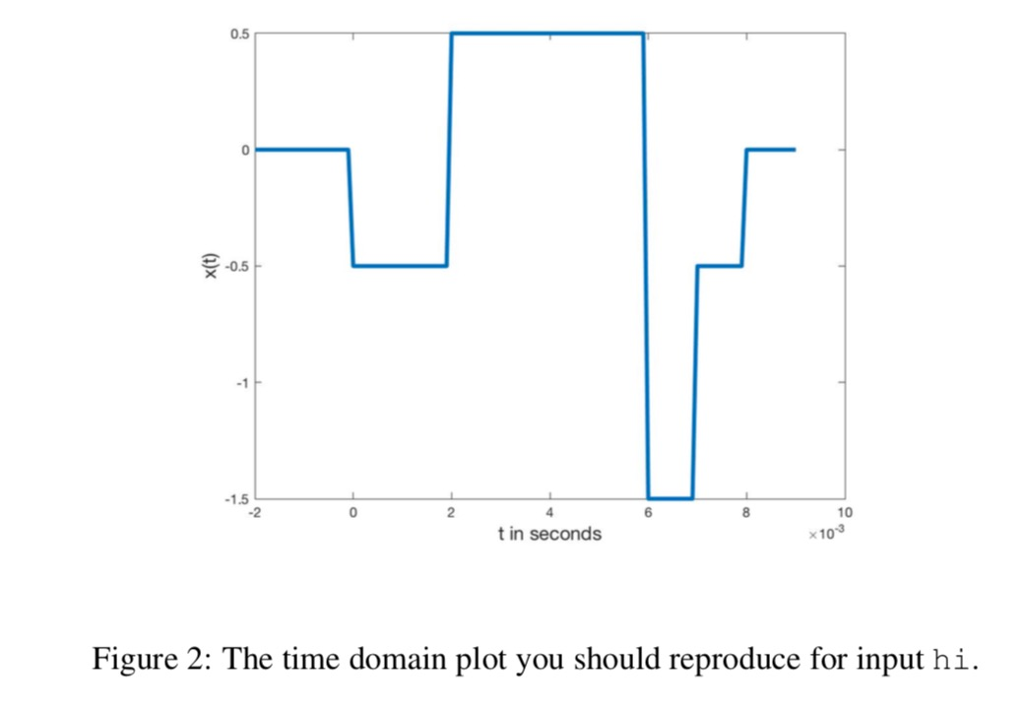
function plot_tx_sig(tx_sig, dig_com_sys, fig_num) % function plot_tx_sig(tx_sig, fig_num) % % Function to plot the transmitted signal. Essentially a plot with % tx_sig.t_range on the x-axis and tx_sig.x on the y axis %
if nargin==1 % fig_num is optional, defaults to 1 fig_num=2; end plot_params = initialize_plot_params(); % Your code here
print(['tx_sig_plot_',dig_com_sys.const],'-djpeg'); end
Step by Step Solution
There are 3 Steps involved in it
Step: 1

Get Instant Access to Expert-Tailored Solutions
See step-by-step solutions with expert insights and AI powered tools for academic success
Step: 2

Step: 3

Ace Your Homework with AI
Get the answers you need in no time with our AI-driven, step-by-step assistance
Get Started


