Answered step by step
Verified Expert Solution
Question
1 Approved Answer
*MATLAB CODE HELP* Hi can someone help me create a for loop to the script file that will allow to compute the statistics for each
*MATLAB CODE HELP*
Hi can someone help me create a for loop to the script file that will allow to compute the statistics for each airport in MATLAB: Average delay, standard deviation, maximum delay, and minimum delay.


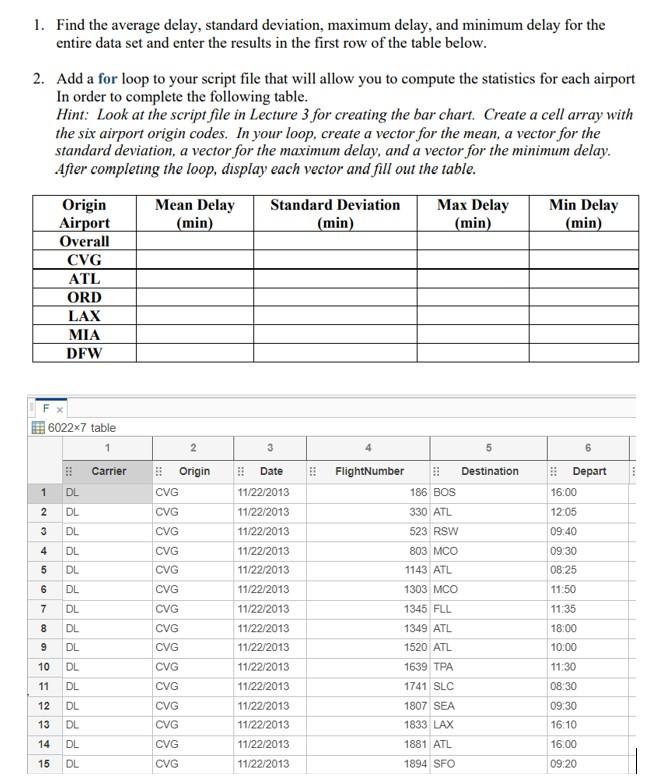
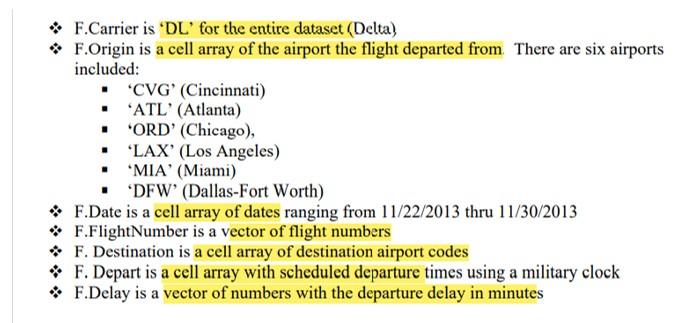
1. Find the average delay, standard deviation, maximum delay, and minimum delay for the entire data set and enter the results in the first row of the table below. 2. Add a for loop to your script file that will allow you to compute the statistics for each airport In order to complete the following table. Hint: Look at the script file in Lecture 3 for creating the bar chart. Create a cell array with the six airport origin codes. In your loop, create a vector for the mean, a vector for the standard deviation, a vector for the maximum delay, and a vector for the minimum delay. After completing the loop, display each vector and fill out the table. Mean Delay (min) Standard Deviation (min) Max Delay (min) Min Delay (min) Origin Airport Overall CVG ATL ORD LAX MIA DFW 6022x7 table 2 Carrier 13 Date 13 1 DL Origin CVG CVG CVG 2 2 Depart 16:00 12:05 09:40 DL FlightNumber Destination 186 BOS 330 ATL 523 RSW 803 MCO 1143 ATL 11/22/2013 11/22/2013 11/22/2013 11/22/2013 11/22/2013 3 DL 4 DL CVG 09.30 08:25 5 5 DL CVG 6 DL CVG 1303 MCO 11:50 7 DL CVG 1345 FLL 11:35 8 DL CVG 18:00 9 DL 10:00 11/22/2013 11/22/2013 11/22/2013 11/22/2013 11/22/2013 11/22/2013 11/22/2013 11/22/2013 10 CVG CVG CVG DL 1349 ATL 1520 ATL 1639 TPA 1741 SLC 1807 SEA 11 DL 11:30 08:30 09:30 16:10 12 DL 23 5 CVG CVG 13 DL 1833 LAX 14 DL CVG 11/22/2013 1881 ATL 16.00 15 DL CVG 11/22/2013 1894 SFO 09:20 | F.Carrier is 'DL' for the entire dataset (Delta) F.Origin is a cell array of the airport the flight departed from. There are six airports included: . "CVG' (Cincinnati) . 'ATL' (Atlanta) 'ORD' (Chicago), . 'LAX' (Los Angeles) . 'MIA' (Miami) . 'DFW' (Dallas-Fort Worth) F.Date is a cell array of dates ranging from 11/22/2013 thru 11/30/2013 F.FlightNumber is a vector of flight numbers F. Destination is a cell array of destination airport codes * F. Depart is a cell array with scheduled departure times using a military clock F.Delay is a vector of numbers with the departure delay in minutes a 1. Find the average delay, standard deviation, maximum delay, and minimum delay for the entire data set and enter the results in the first row of the table below. 2. Add a for loop to your script file that will allow you to compute the statistics for each airport In order to complete the following table. Hint: Look at the script file in Lecture 3 for creating the bar chart. Create a cell array with the six airport origin codes. In your loop, create a vector for the mean, a vector for the standard deviation, a vector for the maximum delay, and a vector for the minimum delay. After completing the loop, display each vector and fill out the table. Mean Delay (min) Standard Deviation (min) Max Delay (min) Min Delay (min) Origin Airport Overall CVG ATL ORD LAX MIA DFW 6022x7 table 2 Carrier 13 Date 13 1 DL Origin CVG CVG CVG 2 2 Depart 16:00 12:05 09:40 DL FlightNumber Destination 186 BOS 330 ATL 523 RSW 803 MCO 1143 ATL 11/22/2013 11/22/2013 11/22/2013 11/22/2013 11/22/2013 3 DL 4 DL CVG 09.30 08:25 5 5 DL CVG 6 DL CVG 1303 MCO 11:50 7 DL CVG 1345 FLL 11:35 8 DL CVG 18:00 9 DL 10:00 11/22/2013 11/22/2013 11/22/2013 11/22/2013 11/22/2013 11/22/2013 11/22/2013 11/22/2013 10 CVG CVG CVG DL 1349 ATL 1520 ATL 1639 TPA 1741 SLC 1807 SEA 11 DL 11:30 08:30 09:30 16:10 12 DL 23 5 CVG CVG 13 DL 1833 LAX 14 DL CVG 11/22/2013 1881 ATL 16.00 15 DL CVG 11/22/2013 1894 SFO 09:20 | F.Carrier is 'DL' for the entire dataset (Delta) F.Origin is a cell array of the airport the flight departed from. There are six airports included: . "CVG' (Cincinnati) . 'ATL' (Atlanta) 'ORD' (Chicago), . 'LAX' (Los Angeles) . 'MIA' (Miami) . 'DFW' (Dallas-Fort Worth) F.Date is a cell array of dates ranging from 11/22/2013 thru 11/30/2013 F.FlightNumber is a vector of flight numbers F. Destination is a cell array of destination airport codes * F. Depart is a cell array with scheduled departure times using a military clock F.Delay is a vector of numbers with the departure delay in minutes a
Step by Step Solution
There are 3 Steps involved in it
Step: 1

Get Instant Access to Expert-Tailored Solutions
See step-by-step solutions with expert insights and AI powered tools for academic success
Step: 2

Step: 3

Ace Your Homework with AI
Get the answers you need in no time with our AI-driven, step-by-step assistance
Get Started


