

Question
MATLAB code is not working (MATLAB R2016a) . Please help me. The graphs below are the expected results. Thank you. % first Cut time1=0:0.01:2.36; %
MATLAB code is not working (MATLAB R2016a) . Please help me. The graphs below are the expected results. Thank you.
% first Cut time1=0:0.01:2.36; % defining time for first cut xf=3+0.375*cos(time1/0.375); % x(t) for first cut; yf=4+0.375*sin(time1/0.375); % y(t) for first cut;
% Second Cut time2=0:0.01:7.86; % defining time for first cut xs=12+1.25*cos(time2/1.25); % x(t) for Second cut; ys=4+1.25*sin(time2/1.25); % y(t) for Second cut;
% Third Cut time3=0.01:0.01:27.65; x1=3+0.75*cos(2/3); x2=12-2*cos(0.5); y1=4-0.75*sin(2/3); y2=4-2*sin(0.5); y3=4+2*sin(0.5); A=abs((x2-x1)+i*(y2-y1)); th=angle((x2-x1)+i*(y2-y1)); t1=1.5*pi-1; t2=t1+A; t3=t2+4*pi-2; bx=cos(th); by=sin(th); ax=3+0.75*cos((4*time3+2)/3); cx=12+2*cos((time3-t2+2*pi+1)/2); ay=4+0.75*sin((4*time3+2)/3); cy=4+2*sin((time3-t2+2*pi+1)/2);
xt=ax.*(us(time3)-us(time3-t1))+x1*us(time3-t1)+bx*(ur(time3-t1)-ur(time3-t2))-x2*us(time3-t2)+cx.*(us(time3-t2)-us(time3-t3))-bx*ur(time3-t3)+x2*us(time3-t3); yt=ay.*(us(time3)-us(time3-t1))+y1*us(time3-t1)+by*(ur(time3-t1)-ur(time3-t2))-y2*us(time3-t2)+cy.*(us(time3-t2)-us(time3-t3))+by*ur(time3-t3)+y3*us(time3-t3); %% % Plotting x(t) and y(t) vs time;
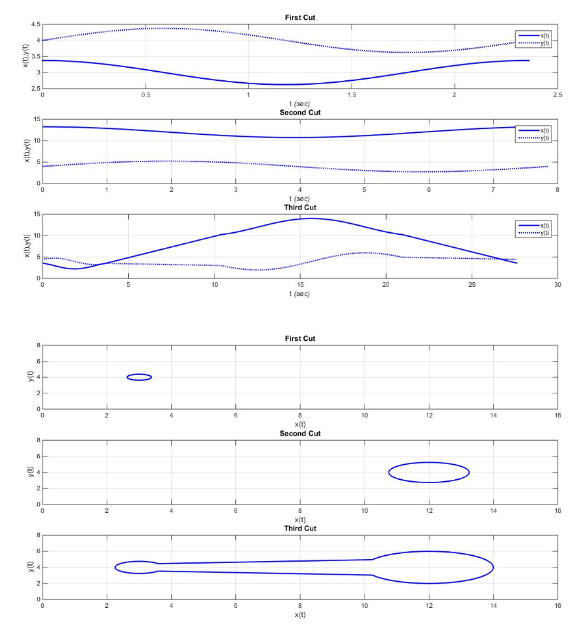
figure; % creating a new figure to plot data subplot(311); % creating a subplot for first cut plot(time1,xf,'b-','linewidth',2);hold on; % plotting x(t) vs time plot(time1,yf,'b:','linewidth',2);grid; % plotting y(t) vs time legend('x(t)','y(t)');title('First Cut'); % creating plot properties xlabel('t \it(sec)');ylabel('x(t),y(t)');
subplot(312); % creating a subplot for second cut plot(time2,xs,'b-','linewidth',2);hold on; % plotting x(t) vs time plot(time2,ys,'b:','linewidth',2);grid; % plotting y(t) vs time legend('x(t)','y(t)');title('Second Cut'); % creating plot properties xlabel('t \it(sec)');ylabel('x(t),y(t)');
subplot(313); % creating a subplot for third cut plot(time3,xt,'b-','linewidth',2);hold on; % plotting x(t) vs time plot(time3,yt,'b:','linewidth',2);grid; % plotting y(t) vs time legend('x(t)','y(t)');title('Third Cut'); % creating plot properties xlabel('t \it(sec)');ylabel('x(t),y(t)'); % %% % Plotting x(t) vs y(t) separately;
figure; % creating a new figure to plot data subplot(311); % creating a subplot for first cut plot(xf,yf,'b-','linewidth',2);grid; % plotting x(t) vs y(t) title('First Cut'); % creating plot title xlabel('x(t)');ylabel('y(t)'); xlim([0 16]);ylim([0 8]); % creating limits for axis
subplot(312); % creating a subplot for second cut plot(xs,ys,'b-','linewidth',2);grid; % plotting x(t) vs y(t) title('Second Cut'); % creating plot title xlabel('x(t)');ylabel('y(t)'); xlim([0 16]);ylim([0 8]); % creating limits for axis
subplot(313); % creating a subplot for third cut plot(xt,yt,'b-','linewidth',2);grid; % plotting x(t) vs y(t) title('Third Cut'); % creating plot title xlabel('x(t)');ylabel('y(t)'); xlim([0 16]);ylim([0 8]); % creating limits for axis
%% % Plotting x(t) vs y(t) on same figure;
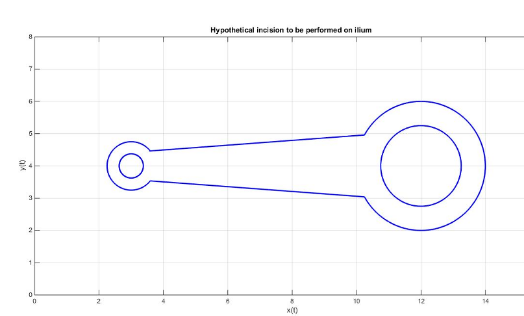
figure; % creating a new figure to plot data plot(xf,yf,'b-','linewidth',2);hold on; % plotting x(t) vs y(t) for first cut plot(xs,ys,'b-','linewidth',2);hold on; % plotting x(t) vs y(t) for second cut plot(xt,yt,'b-','linewidth',2);grid; % plotting x(t) vs y(t) for third cut title('Hypothetical incision to be performed on ilium '); % creating plot title xlabel('x(t)');ylabel('y(t)'); xlim([0 16]);ylim([0 8]); % creating limits for axis
45 First Cut Second Cut Third Cut rst Cut Second Cut Third Cut 45 First Cut Second Cut Third Cut rst Cut Second Cut Third CutStep by Step Solution
There are 3 Steps involved in it
Step: 1

Get Instant Access to Expert-Tailored Solutions
See step-by-step solutions with expert insights and AI powered tools for academic success
Step: 2

Step: 3
Ace Your Homework with AI
Get the answers you need in no time with our AI-driven, step-by-step assistance
Get Started
Handbook Of Relational Database Design
Authors: Candace C. Fleming, Barbara Von Halle
1st Edition
0201114348, 978-0201114348