

Answered step by step
Verified Expert Solution
Question
1 Approved Answer
MATLAB CODE ONLY! Consider the following exponentially decaying continuous signal: f(t)=eat for a>0 Task 1 Plot f(t) [5%] (a) Write a code to plot f(t),5t5,
MATLAB CODE ONLY! 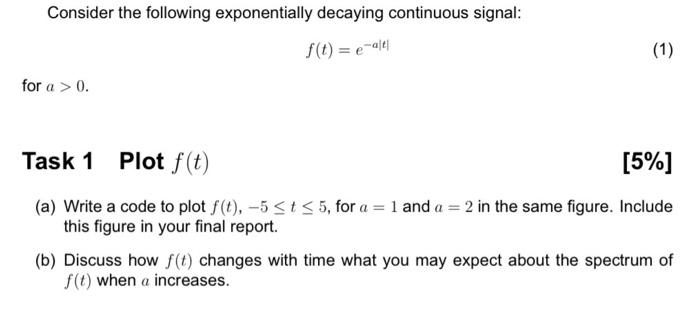
Step by Step Solution
There are 3 Steps involved in it
Step: 1

Get Instant Access to Expert-Tailored Solutions
See step-by-step solutions with expert insights and AI powered tools for academic success
Step: 2

Step: 3
Ace Your Homework with AI
Get the answers you need in no time with our AI-driven, step-by-step assistance
Get Started
Put Your Data To Work 52 Tips And Techniques For Effectively Managing Your Database
Authors: Wes Trochlil
1st Edition
0880343079, 978-0880343077