

Answered step by step
Verified Expert Solution
Question
1 Approved Answer
MATLAB code with comments The lot for the number of weeks bats are Show two significan The breakee ligures The program should generate a the
MATLAB code with comments 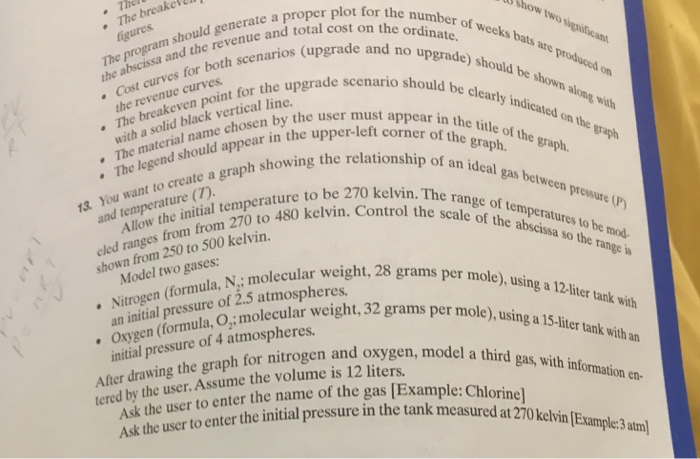
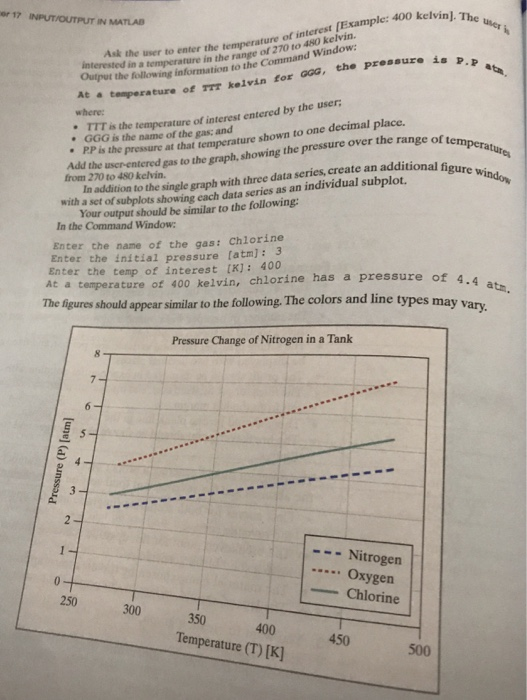
The lot for the number of weeks bats are Show two significan The breakee ligures The program should generate a the abscissa and the revenue and t Cost curves for both scenario al cost on the ordinate. e and n o upgrade) should be shown along with should be clearly indicated on the graph r the upgrade scenario nt fo be the revenue curves The breakeven point for the upgrade s . The material name chosen by the user with a sterial namepear in the upper-let corner of the grathof the The legend should i h a solid black vertical line uld appear ionship of an ideal gas between pressure 13. You want to create a graph showing the rel vin. The range of temperatures to be mod ure to be 270 go kelvi pressure eled ranges from from 270 to 4 Aloes from from 270to 480 kelvin. Control the serange of tem shown from 250 to 500 kelvin. and temperature (T) Allow the initial temperature to be2 scale of the abscissa so the range n (formula, N,; molecular weight, 28 grams n (formula, 02:molecular 32 gram Model two gases: er mole), using a 12-liter tank with an initial pressure of Oxygen initial pressure of 4 atmospheres. 2.5 atmospheres. icht, 32 grams per mole),using a 15-liter tank with After drawing the graph for oxygen, m tered by the user. Assume the volume is 12 liters r tank with an nitrogen and oxygen, model a third gas with information en. Ask the user to enter the name of the gas [Example: C Ask the user to enter the initial pressure in the tank me hlorin measured at 270 kelvin(Example:3 atm er 17 INPUT/OUTPUT IN MATLAB : 400 kelvin). The ue Ask the user to enter the temperatnoto 480 kelvin in the range of 270 kelvin. interested in a temperature At temperature of TTT kelvin for TTTis the temperature of interest entered by the user Outiput the following information to thec GGG is the name of the gas, and P.P is the shown to one decimal place. * pressure at that temperature In addition to the single graph with three data series, create an additional f Your output should be similar to the following n o oenered gas to the graph,showing the pressure over the range of tempe figure window with a set of subplots showing each data series as an individual subplot In the Command Window Enter the name of the gas: Chlorine Enter the initial pressure [atm]: 3 Enter the temp of interest (K]: 400 At a temperature of 400 kelvin, chlorine has a pressure of q The figures should 4.4 atm. appear similar to the following. The colors and line types may vary Pressure Change of Nitrogen in a Tank Nitrogen Oxygen Chlorine 250 300 400 Temperature (T) [K] 450 500 Step by Step Solution
There are 3 Steps involved in it
Step: 1

Get Instant Access to Expert-Tailored Solutions
See step-by-step solutions with expert insights and AI powered tools for academic success
Step: 2

Step: 3
Ace Your Homework with AI
Get the answers you need in no time with our AI-driven, step-by-step assistance
Get Started
Expert Oracle Database Architecture
Authors: Thomas Kyte, Darl Kuhn
3rd Edition
1430262990, 9781430262992