

Answered step by step
Verified Expert Solution
Question
1 Approved Answer
matlab codes in order to obtain the figures shown in the question is needed 2. COMPUTING VOLUMES (40 PTS) A particular conical red cup is
matlab codes in order to obtain the figures shown in the question is needed
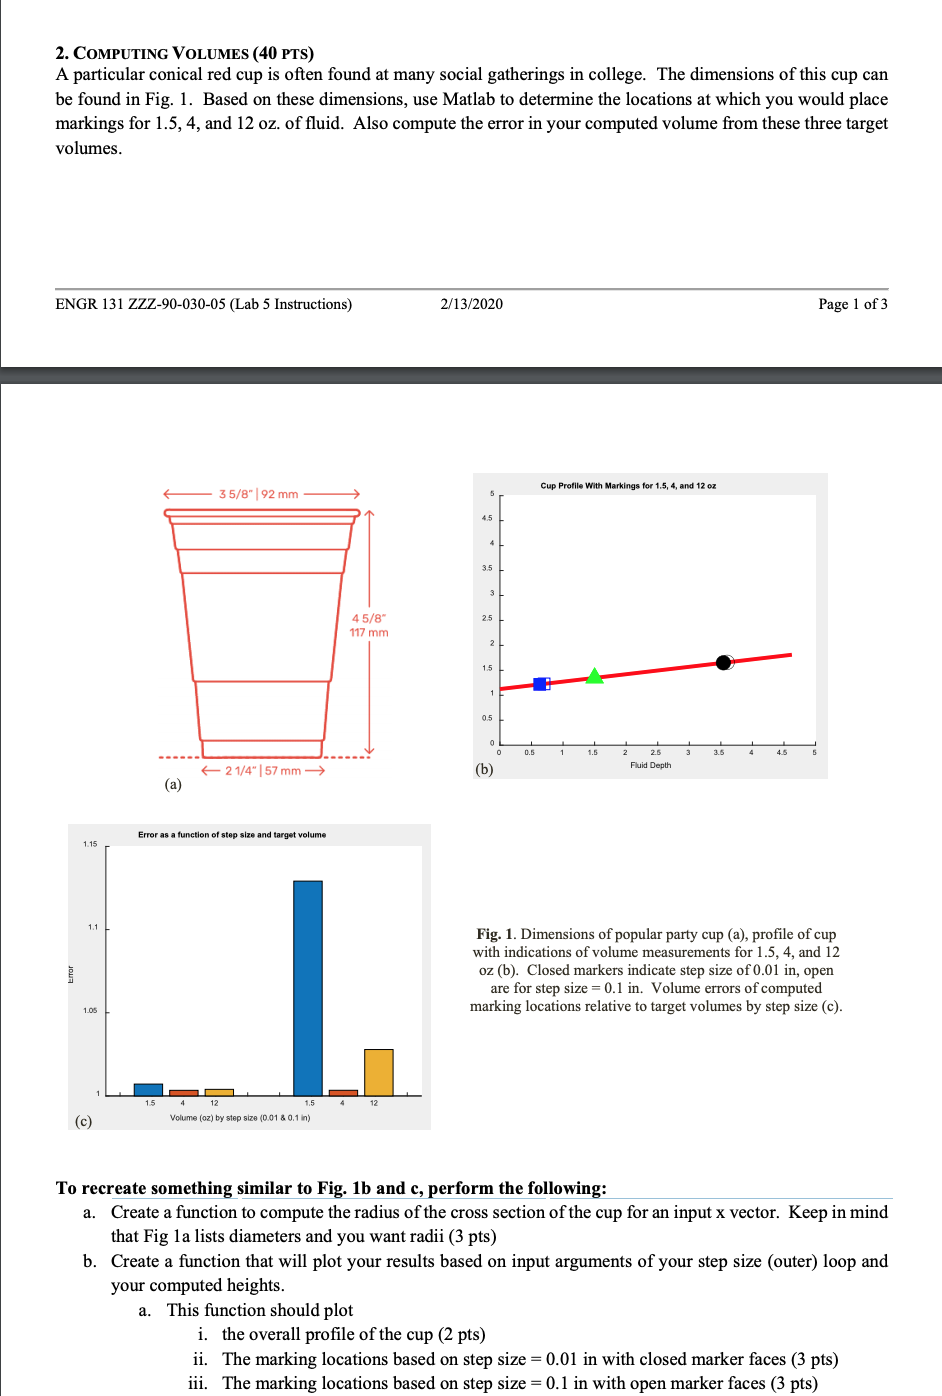
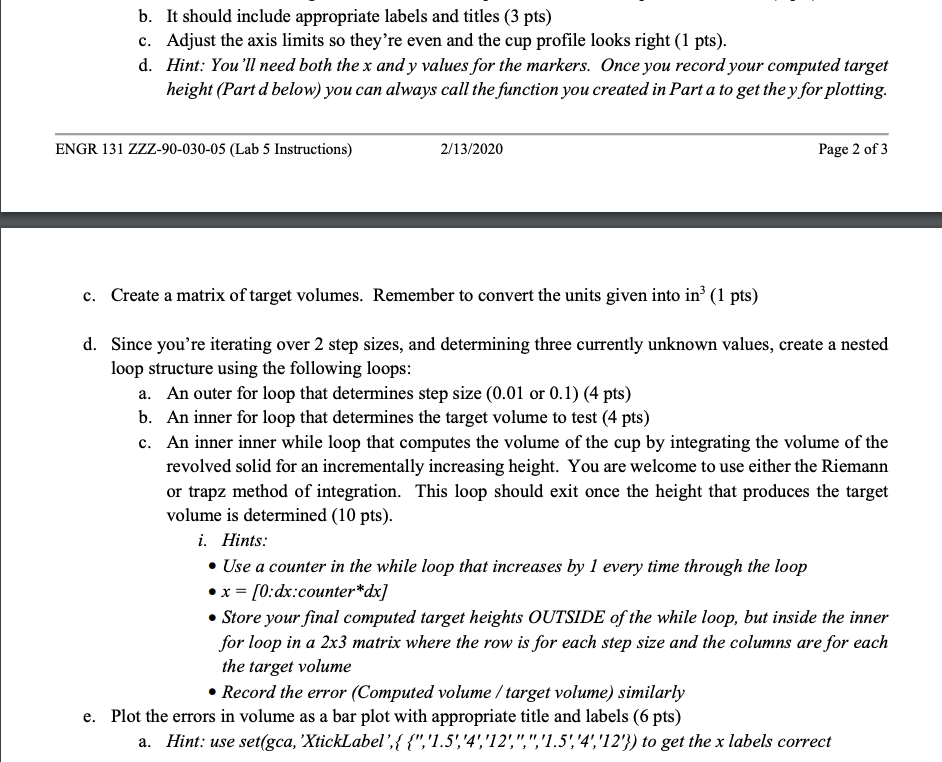
2. COMPUTING VOLUMES (40 PTS) A particular conical red cup is often found at many social gatherings in college. The dimensions of this cup can be found in Fig. 1. Based on these dimensions, use Matlab to determine the locations at which you would place markings for 1.5, 4, and 12 oz. of fluid. Also compute the error in your computed volume from these three target volumes. ENGR 131 ZZZ-90-030-05 (Lab 5 Instructions) ions) 2/13/2020 Page 1 of 3 Cup Profile With Markings for 1.5, 4, and 12 oz 35/8" 92 mm 45/8" 117 mm Fluid Depth 21/4" | 57 mm 14" 152 (a) Error as a function of step size and target volume 1.15 Fig. 1. Dimensions of popular party cup (a), profile of cup with indications of volume measurements for 1.5, 4, and 12 oz (b). Closed markers indicate step size of 0.01 in, open are for step size = 0.1 in. Volume errors of computed marking locations relative to target volumes by step size (c). 1 L 15 4 12 1. 54 Volume (oz) by step size (0.01 & 0.1 in) (C) To recreate something similar to Fig. 1b and c, perform the following: a. Create a function to compute the radius of the cross section of the cup for an input x vector. Keep in mind that Fig la lists diameters and you want radii (3 pts) b. Create a function that will plot your results based on input arguments of your step size (outer) loop and your computed heights. a. This function should plot i. the overall profile of the cup (2 pts) ii. The marking locations based on step size = 0.01 in with closed marker faces (3 pts) iii. The marking locations based on step size = 0.1 in with open marker faces (3 pts) b. It should include appropriate labels and titles (3 pts) c. Adjust the axis limits so they're even and the cup profile looks right (1 pts). d. Hint: You'll need both the x and y values for the markers. Once you record your computed target height (Part d below) you can always call the function you created in Part a to get the y for plotting. ENGR 131 ZZZ-90-030-05 (Lab 5 Instructions) 2/13/2020 Page 2 of 3 c. Create a matrix of target volumes. Remember to convert the units given into in (1 pts) d. Since you're iterating over 2 step sizes, and determining three currently unknown values, create a nested loop structure using the following loops: a. An outer for loop that determines step size (0.01 or 0.1) (4 pts) b. An inner for loop that determines the target volume to test (4 pts) c. An inner inner while loop that computes the volume of the cup by integrating the volume of the revolved solid for an incrementally increasing height. You are welcome to use either the Riemann or trapz method of integration. This loop should exit once the height that produces the target volume is determined (10 pts). i. Hints: Use a counter in the while loop that increases by 1 every time through the loop x = (0:dx:counter*dx] Store your final computed target heights OUTSIDE of the while loop, but inside the inner for loop in a 2x3 matrix where the row is for each step size and the columns are for each the target volume Record the error (Computed volume / target volume) similarly e. Plot the errors in volume as a bar plot with appropriate title and labels (6 pts) a. Hint: use set(gca, 'XtickLabel', {{"'1.51,4','12'",",'1.514','12') to get the x labels correct 2. COMPUTING VOLUMES (40 PTS) A particular conical red cup is often found at many social gatherings in college. The dimensions of this cup can be found in Fig. 1. Based on these dimensions, use Matlab to determine the locations at which you would place markings for 1.5, 4, and 12 oz. of fluid. Also compute the error in your computed volume from these three target volumes. ENGR 131 ZZZ-90-030-05 (Lab 5 Instructions) ions) 2/13/2020 Page 1 of 3 Cup Profile With Markings for 1.5, 4, and 12 oz 35/8" 92 mm 45/8" 117 mm Fluid Depth 21/4" | 57 mm 14" 152 (a) Error as a function of step size and target volume 1.15 Fig. 1. Dimensions of popular party cup (a), profile of cup with indications of volume measurements for 1.5, 4, and 12 oz (b). Closed markers indicate step size of 0.01 in, open are for step size = 0.1 in. Volume errors of computed marking locations relative to target volumes by step size (c). 1 L 15 4 12 1. 54 Volume (oz) by step size (0.01 & 0.1 in) (C) To recreate something similar to Fig. 1b and c, perform the following: a. Create a function to compute the radius of the cross section of the cup for an input x vector. Keep in mind that Fig la lists diameters and you want radii (3 pts) b. Create a function that will plot your results based on input arguments of your step size (outer) loop and your computed heights. a. This function should plot i. the overall profile of the cup (2 pts) ii. The marking locations based on step size = 0.01 in with closed marker faces (3 pts) iii. The marking locations based on step size = 0.1 in with open marker faces (3 pts) b. It should include appropriate labels and titles (3 pts) c. Adjust the axis limits so they're even and the cup profile looks right (1 pts). d. Hint: You'll need both the x and y values for the markers. Once you record your computed target height (Part d below) you can always call the function you created in Part a to get the y for plotting. ENGR 131 ZZZ-90-030-05 (Lab 5 Instructions) 2/13/2020 Page 2 of 3 c. Create a matrix of target volumes. Remember to convert the units given into in (1 pts) d. Since you're iterating over 2 step sizes, and determining three currently unknown values, create a nested loop structure using the following loops: a. An outer for loop that determines step size (0.01 or 0.1) (4 pts) b. An inner for loop that determines the target volume to test (4 pts) c. An inner inner while loop that computes the volume of the cup by integrating the volume of the revolved solid for an incrementally increasing height. You are welcome to use either the Riemann or trapz method of integration. This loop should exit once the height that produces the target volume is determined (10 pts). i. Hints: Use a counter in the while loop that increases by 1 every time through the loop x = (0:dx:counter*dx] Store your final computed target heights OUTSIDE of the while loop, but inside the inner for loop in a 2x3 matrix where the row is for each step size and the columns are for each the target volume Record the error (Computed volume / target volume) similarly e. Plot the errors in volume as a bar plot with appropriate title and labels (6 pts) a. Hint: use set(gca, 'XtickLabel', {{"'1.51,4','12'",",'1.514','12') to get the x labels correct Step by Step Solution
There are 3 Steps involved in it
Step: 1

Get Instant Access to Expert-Tailored Solutions
See step-by-step solutions with expert insights and AI powered tools for academic success
Step: 2

Step: 3
Ace Your Homework with AI
Get the answers you need in no time with our AI-driven, step-by-step assistance
Get Started
Machine Learning And Knowledge Discovery In Databases European Conference Ecml Pkdd 2016 Riva Del Garda Italy September 19 23 2016 Proceedings Part 1 Lnai 9851
Authors: Paolo Frasconi ,Niels Landwehr ,Giuseppe Manco ,Jilles Vreeken
1st Edition
3319461273, 978-3319461274