

Question
MATLAB coding help How to plot this matrix multiplication 100 times and the x-axis is t from 0 to 100 and y-axis is to be
MATLAB coding help
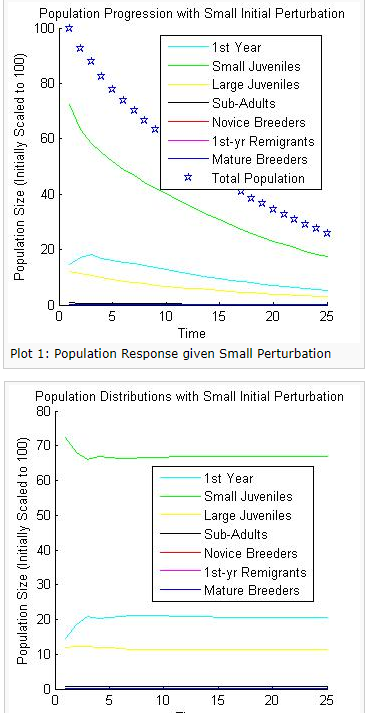
How to plot this matrix multiplication 100 times and the x-axis is t from 0 to 100 and y-axis is to be on a logarithmic scale using '' semilogy'' command? it should plot maybe 7 lines and looks like the similar to one of the plots below. Thanks for helping!
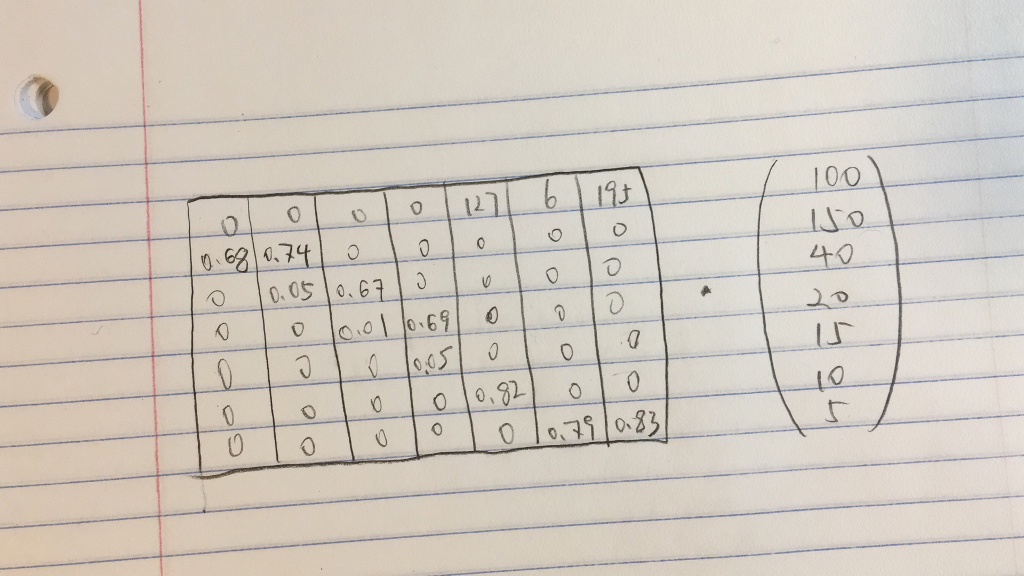
the question said to advance the matrix multiplication 100-time steps. and each column is one stage. then plot the total population as wee as the number of individuals in each stage on the same axes from t =0 to 100
if this helps
100 0 62 4.740 210 90 0 100 0 62 4.740 210 90 0Step by Step Solution
There are 3 Steps involved in it
Step: 1

Get Instant Access to Expert-Tailored Solutions
See step-by-step solutions with expert insights and AI powered tools for academic success
Step: 2

Step: 3
Ace Your Homework with AI
Get the answers you need in no time with our AI-driven, step-by-step assistance
Get Started
Data Management Databases And Organizations
Authors: Watson Watson
5th Edition
0471715360, 978-0471715368