Answered step by step
Verified Expert Solution
Question
1 Approved Answer
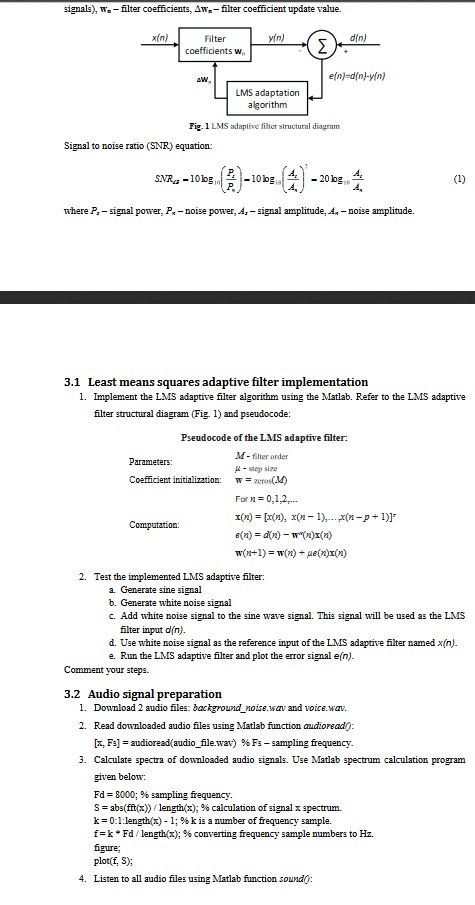
MATLAB CODING:DIGITAL SIGNAL PROCESSING signals), wn-filter coefficients. _ filter coefficient update value. xin) Filter coefficients w in) din) eln)-d(n)-yln) Aw LMS adaptation algorithm Fig. 1


MATLAB CODING:DIGITAL SIGNAL PROCESSING
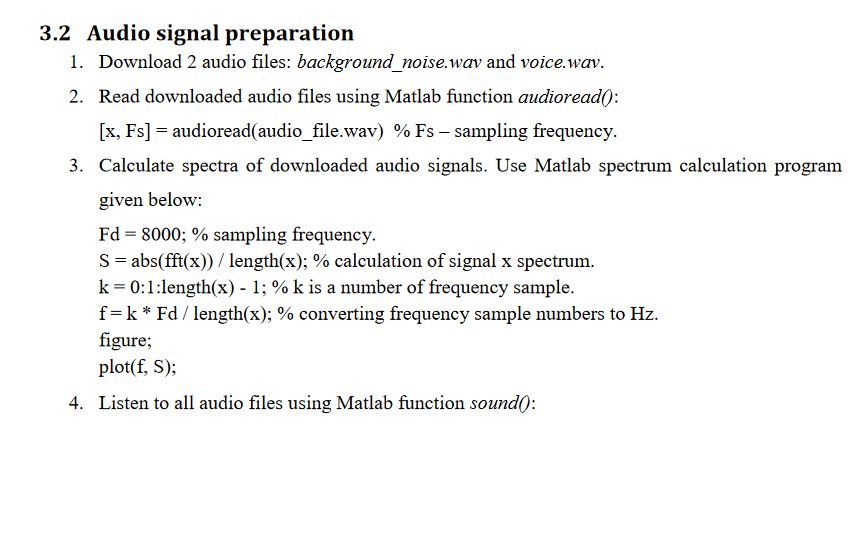
signals), wn-filter coefficients. _ filter coefficient update value. xin) Filter coefficients w in) din) eln)-d(n)-yln) Aw LMS adaptation algorithm Fig. 1 LMS adaptive filher structural diagram Signal to noise ratio (SNR) equation: na,.iobg(2).iobr(2)20h. where P,-signal power. P-noise power, signal amplitude 4-noise amplitude. 3.1 Least means squares adaptive filter implementation 1. Implement the LMS adaptive filter algorithm using the Matlab. Refer to the LMS adaptive filter structural diagram (Fig. 1) and pseudocode: Pseudocode of the LMS adaptive filter: M filter order -siep size w=zeros(U) For n = 0,1,2, Parameters Coefficient initialization: x(n)-[n), x(n-1)n-1) 2. Test the implemented LMS adaptive filter: a. Generate sine signal b. Generate white noise signal c. Add white noise signal to the sine wave signal. This signal will be used as the LMS filter input din) d. Use white noise signal as the reference input of the LMS adaptive filter named x(n). e. Run the LMS adaptive filter and plot the error signal e(n). Comment your steps 3.2 Audio signal preparation 1. Download 2 audio files: background noie.wav and voice.wav. 2. Read downloaded audio files using Matlab function audioread [x, Fs] = audioread(audio file.wav) 96 Fs-sampling frequency. 3. Calculate spectra of downloaded audio signals. Use Matlab spectrum calculation program given below Fd = 8000.96 sampling frequency s-abs(fft(x)) / length(x); % calculation of signal spectrum. k = 0: 1:length(x)-1 ; % k is a number of frequency sample. f-k Fd lengthx);converting frequency sample numbers to Hz. figure; plot(f, S); Listen to all audio files using 4. Matlab function sound: signals), wn-filter coefficients. _ filter coefficient update value. xin) Filter coefficients w in) din) eln)-d(n)-yln) Aw LMS adaptation algorithm Fig. 1 LMS adaptive filher structural diagram Signal to noise ratio (SNR) equation: na,.iobg(2).iobr(2)20h. where P,-signal power. P-noise power, signal amplitude 4-noise amplitude. 3.1 Least means squares adaptive filter implementation 1. Implement the LMS adaptive filter algorithm using the Matlab. Refer to the LMS adaptive filter structural diagram (Fig. 1) and pseudocode: Pseudocode of the LMS adaptive filter: M filter order -siep size w=zeros(U) For n = 0,1,2, Parameters Coefficient initialization: x(n)-[n), x(n-1)n-1) 2. Test the implemented LMS adaptive filter: a. Generate sine signal b. Generate white noise signal c. Add white noise signal to the sine wave signal. This signal will be used as the LMS filter input din) d. Use white noise signal as the reference input of the LMS adaptive filter named x(n). e. Run the LMS adaptive filter and plot the error signal e(n). Comment your steps 3.2 Audio signal preparation 1. Download 2 audio files: background noie.wav and voice.wav. 2. Read downloaded audio files using Matlab function audioread [x, Fs] = audioread(audio file.wav) 96 Fs-sampling frequency. 3. Calculate spectra of downloaded audio signals. Use Matlab spectrum calculation program given below Fd = 8000.96 sampling frequency s-abs(fft(x)) / length(x); % calculation of signal spectrum. k = 0: 1:length(x)-1 ; % k is a number of frequency sample. f-k Fd lengthx);converting frequency sample numbers to Hz. figure; plot(f, S); Listen to all audio files using 4. Matlab function soundStep by Step Solution
There are 3 Steps involved in it
Step: 1

Get Instant Access to Expert-Tailored Solutions
See step-by-step solutions with expert insights and AI powered tools for academic success
Step: 2

Step: 3

Ace Your Homework with AI
Get the answers you need in no time with our AI-driven, step-by-step assistance
Get Started


