

Answered step by step
Verified Expert Solution
Question
1 Approved Answer
MATLAB: Combine four (2 by 2) plot windows on one figure for the following four functions for x = 0 to 10 with an increment
MATLAB: Combine four (2 by 2) plot windows on one figure for the following four functions for x = 0 to 10 with an increment of 0.1. 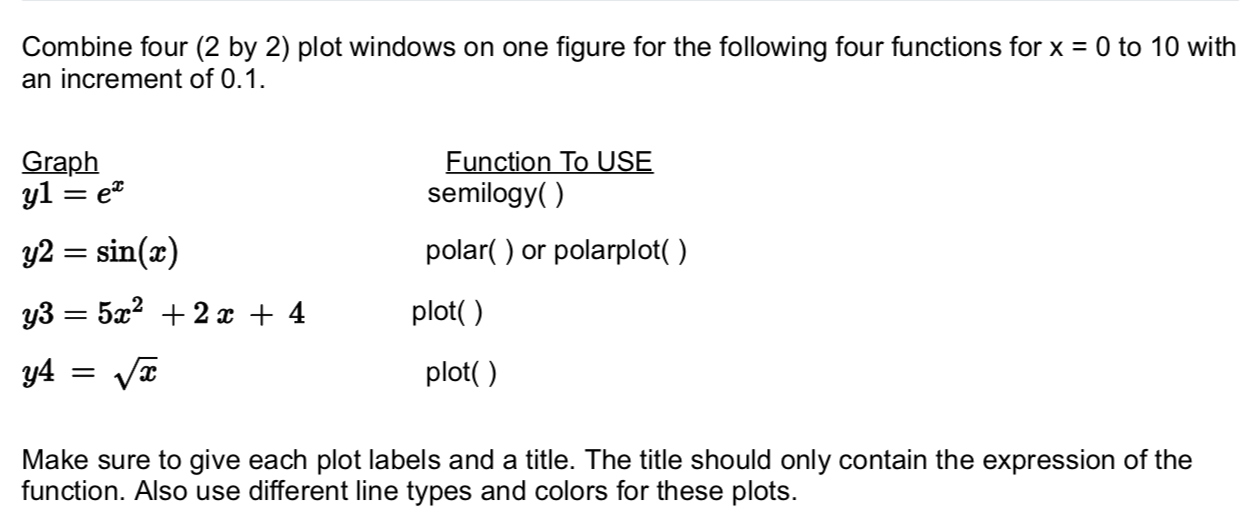
Step by Step Solution
There are 3 Steps involved in it
Step: 1

Get Instant Access to Expert-Tailored Solutions
See step-by-step solutions with expert insights and AI powered tools for academic success
Step: 2

Step: 3
Ace Your Homework with AI
Get the answers you need in no time with our AI-driven, step-by-step assistance
Get Started
Database Concepts International Edition
Authors: David M. Kroenke
6th Edition International Edition
0133098222, 978-0133098228