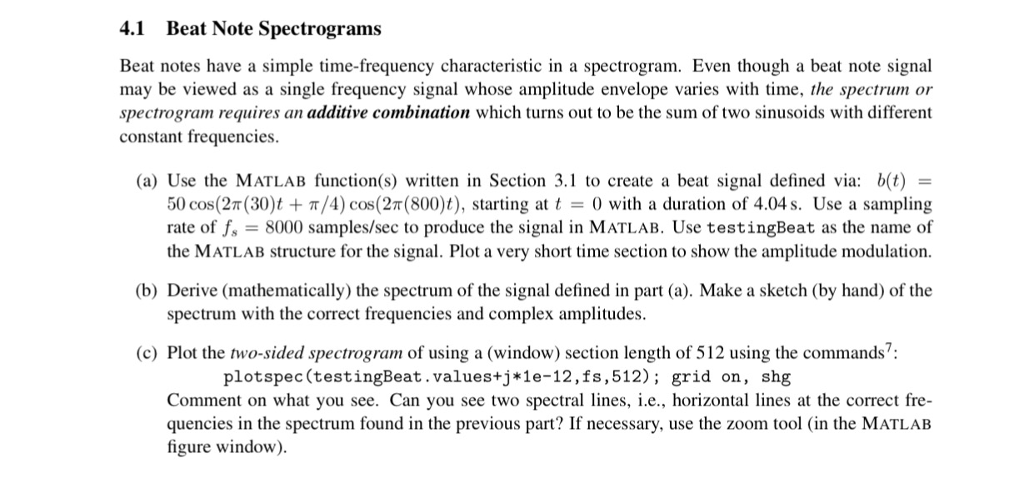
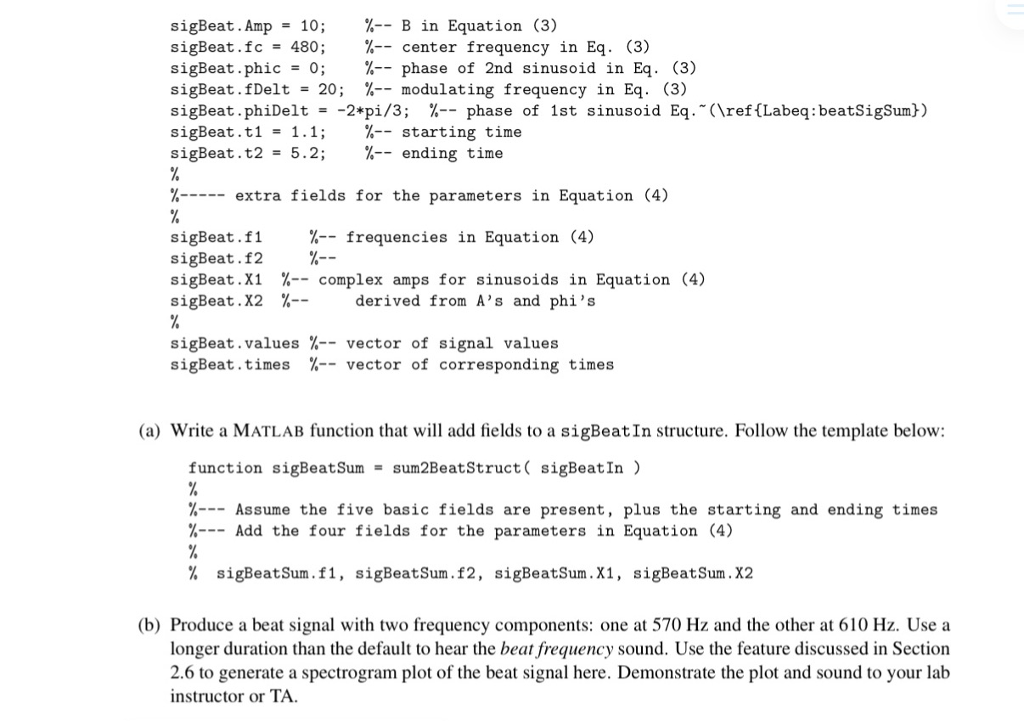
MATLAB. Complete section 4.1. PLEASE SHOW YOUR CODE AS WELL AS YOUR PLOTTED SPECTROGRAM. I have also attached below section 3.1 for reference.


4.1 Beat Note Spectrograms Beat notes have a simple time-frequency characteristic in a spectrogram. Even though a beat note signal may be viewed as a single frequency signal whose amplitude envelope varies with time, the spectrum or spectrogram requires an additive combination which turns out to be the sum of two sinusoids with different constant frequencies. (a) Use the MATLAB function(s) written in Section 3.1 to create a beat signal defined via: b(t) = 50 cos(2n(30)t + /4) cos(2n(800)t), starting at t = 0 with a duration of 4.04 s. Use a sampling rate of fs-8000 samples/sec to produce the signal in MATLAB. Use test ingBeat as the name of the MATLAB structure for the signal. Plot a very short time section to show the amplitude modulation. (b) Derive (mathematically) the spectrum of the signal defined in part (a). Make a sketch (by hand) of the spectrum with the correct frequencies and complex amplitudes. (c) Plot the two-sided spectrogram of using a (window) section length of 512 using the commands plotspec(testingBeat.values+j*1e-12,fs,512); grid on, shg Comment on what you see. Can you see two spectral lines, i.e., horizontal lines at the correct fre- quencies in the spectrum found in the previous part? If necessary, use the zoom tool (in the MaTLAB figure window). 4.1 Beat Note Spectrograms Beat notes have a simple time-frequency characteristic in a spectrogram. Even though a beat note signal may be viewed as a single frequency signal whose amplitude envelope varies with time, the spectrum or spectrogram requires an additive combination which turns out to be the sum of two sinusoids with different constant frequencies. (a) Use the MATLAB function(s) written in Section 3.1 to create a beat signal defined via: b(t) = 50 cos(2n(30)t + /4) cos(2n(800)t), starting at t = 0 with a duration of 4.04 s. Use a sampling rate of fs-8000 samples/sec to produce the signal in MATLAB. Use test ingBeat as the name of the MATLAB structure for the signal. Plot a very short time section to show the amplitude modulation. (b) Derive (mathematically) the spectrum of the signal defined in part (a). Make a sketch (by hand) of the spectrum with the correct frequencies and complex amplitudes. (c) Plot the two-sided spectrogram of using a (window) section length of 512 using the commands plotspec(testingBeat.values+j*1e-12,fs,512); grid on, shg Comment on what you see. Can you see two spectral lines, i.e., horizontal lines at the correct fre- quencies in the spectrum found in the previous part? If necessary, use the zoom tool (in the MaTLAB figure window)


