Answered step by step
Verified Expert Solution
Question
1 Approved Answer
MATLAB For each day of the week, you pull 200 wickets off the production line and measure their wickosity. (The plant produces millions of wickets
MATLAB 
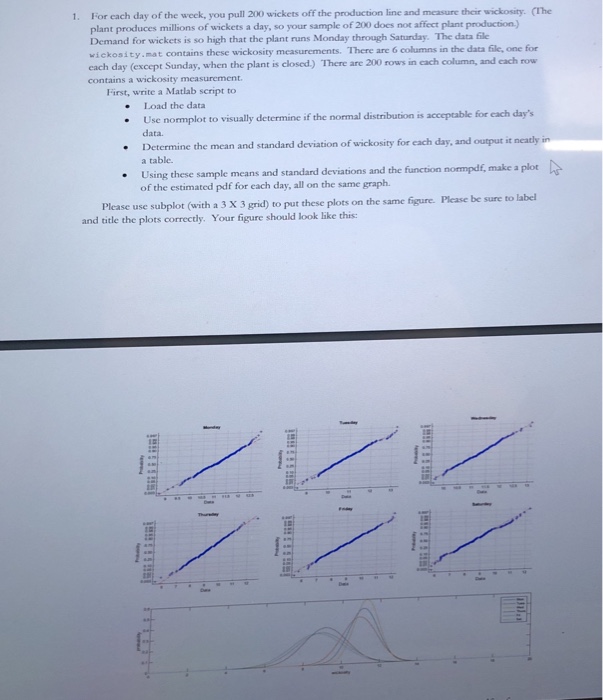
1. For each day of the week, you pull 200 wickets off the production line and measure their wickosity. (The plant produces millions of wickets a day, so your sample of 200 does not affect plant production.) Demand for wickets is so high that the plant runs Monday through Saturday. The data file wickosity.mat contains these wickosity measurements. There are 6 columns in the data file, one for each day (except Sunday, when the plant is closed.) There are 200 rows in each column, and each row contains a wickosity measurement. First, write a Matlab script to Load the data Use normplot to visually determine if the normal distribution is acceptable for each day's data Determine the mean and standard deviation of wickosity for each day, and ourput it neatly Using these sample means and standard deviations and the function nompdf, make a plo a table. of the estimated pdf for each day, all on the same graph. Please be sure to label Please use subplot (with a 3 x 3 grid) to put these plots on the same figure. and title the plots correctly. Your figure should look like this For each day of the week, you pull 200 wickets off the production line and measure their wickosity. (The plant produces millions of wickets a day, so your sample of 200 does not affect plant production.) Demand for wickets is so high that the plant runs Monday through Saturday. The data file wickosity.mat contains these wickosity measurements. There are 6 columns in the data file, one for each day (except Sunday, when the plant is closed.) There are 200 rows in each column, and each row contains a wickosity measurement. First, write a Matlab script to Load the data Use normplot to visually determine if the normal distribution is acceptable for each days data. Determine the mean and standard deviation of wickosity for each day, and output it neatly in a table. Using these sample means and standard deviations and the function normpdf, make a plot of the estimated pdf for each day, all on the same graph. Please use subplot (with a 3 X 3 grid) to put these plots on the same figure. Please be sure to label and title the plots correctly. Your figure should look like this:

Step by Step Solution
There are 3 Steps involved in it
Step: 1

Get Instant Access to Expert-Tailored Solutions
See step-by-step solutions with expert insights and AI powered tools for academic success
Step: 2

Step: 3

Ace Your Homework with AI
Get the answers you need in no time with our AI-driven, step-by-step assistance
Get Started


