Answered step by step
Verified Expert Solution
Question
1 Approved Answer
MATLAB for Engineers HELP!! Please help with Part A). I have the code below but I keep getting an error %PART A clc; clear all;
MATLAB for Engineers HELP!!
Please help with Part A). I have the code below but I keep getting an error
%PART A clc; clear all; pwf= [3865.6, 2991.1, 1770.8]; qo=[988.2, 2167.2, 3180.4];
syms p c n n=linspace(0.5,1,10) for (i=0.5:1) eq1=qo==(c((p^2)-(pwf.^2)).^n(i)); [p,c]=vpasolve(eq1,[p,c],[0,inf]); end

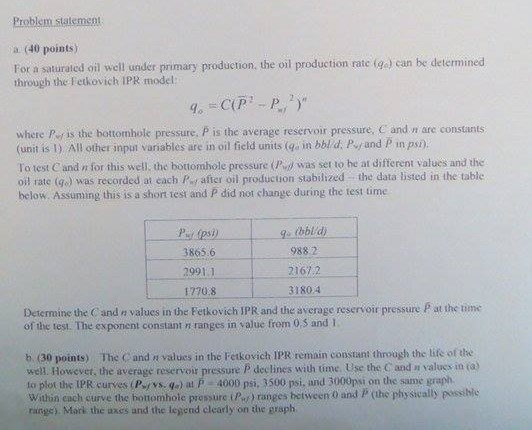
Problem statement a. (40 points) For a saturated oil well under primary production, the oil production rate (g-) can be determined through the Fetkovich IPR model: where Per is the bottomhole pressure. P is the average reservoir pressure, C and n are constants (unit is 1) All other input variables are in oil field units (ge in bbl d, Py and P inpsi) To test C and n for this well, the bottmhole pressure (Pud was set to he at different values and the oil rate (Go) was recorded at cach Pay after oil production stabilized the data listed in the table below. Assuming this is a short test and did not change during the test time 3865.6 2991.1 17708 9 bblid) 9882 2167.2 3180 4 Determine the C and n values in the Fetkovich IPR and the average reservoir pressure P at the time of the test. The exponent constant n ranges in value from 0 S and 1 b. (30 points) The C and n values in the Fetkovich IPR remain constant through the life of the well. Howevet, the average reservoir pressure P declines with time. Use the C and n values in (a) to plot the IPR curves (Pvs. ga) at P 4000 psi. 3500 psi, and 3000psi on the same graph, within each curve the honomhole pressure ir.) ranges between 0 and p (te physically posible runge). Mark the axes and the leend clearly on the graph Problem statement a. (40 points) For a saturated oil well under primary production, the oil production rate (g-) can be determined through the Fetkovich IPR model: where Per is the bottomhole pressure. P is the average reservoir pressure, C and n are constants (unit is 1) All other input variables are in oil field units (ge in bbl d, Py and P inpsi) To test C and n for this well, the bottmhole pressure (Pud was set to he at different values and the oil rate (Go) was recorded at cach Pay after oil production stabilized the data listed in the table below. Assuming this is a short test and did not change during the test time 3865.6 2991.1 17708 9 bblid) 9882 2167.2 3180 4 Determine the C and n values in the Fetkovich IPR and the average reservoir pressure P at the time of the test. The exponent constant n ranges in value from 0 S and 1 b. (30 points) The C and n values in the Fetkovich IPR remain constant through the life of the well. Howevet, the average reservoir pressure P declines with time. Use the C and n values in (a) to plot the IPR curves (Pvs. ga) at P 4000 psi. 3500 psi, and 3000psi on the same graph, within each curve the honomhole pressure ir.) ranges between 0 and p (te physically posible runge). Mark the axes and the leend clearly on the graph
Step by Step Solution
There are 3 Steps involved in it
Step: 1

Get Instant Access to Expert-Tailored Solutions
See step-by-step solutions with expert insights and AI powered tools for academic success
Step: 2

Step: 3

Ace Your Homework with AI
Get the answers you need in no time with our AI-driven, step-by-step assistance
Get Started


