 Matlab Grader
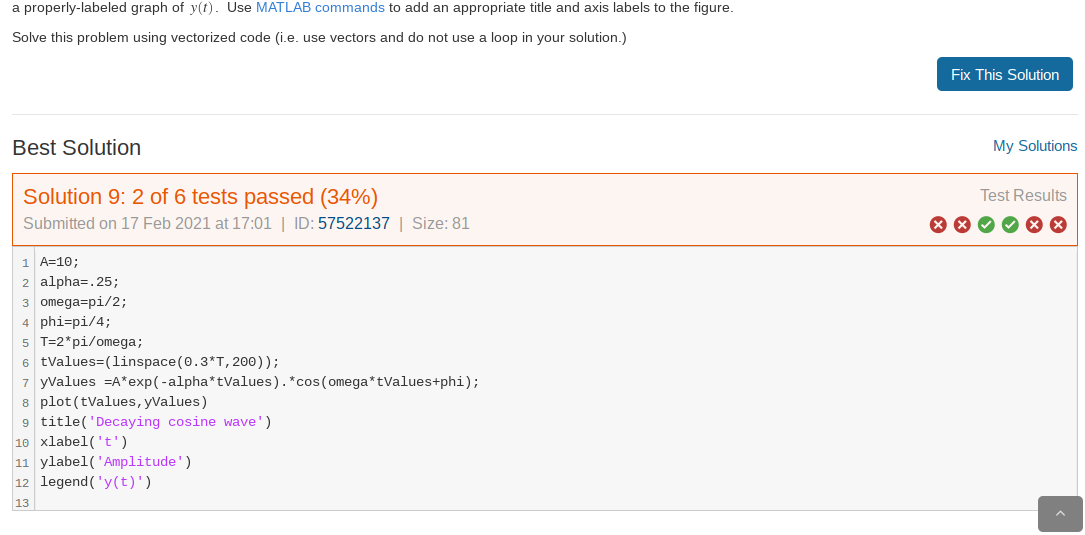
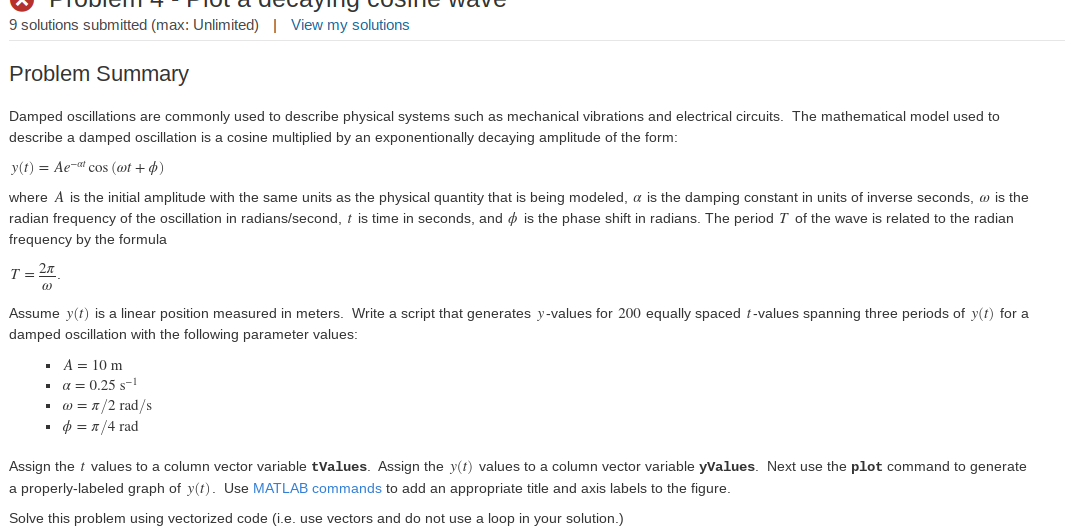
a properly-labeled graph of y(t). Use MATLAB commands to add an appropriate title and axis labels to the figure. Solve this problem using vectorized code (i.e. use vectors and do not use a loop in your solution.) Fix This Solution Best Solution My Solutions Test Results Solution 9: 2 of 6 tests passed (34%) Submitted on 17 Feb 2021 at 17:01 | ID:57522137 Size: 81 1 A=10; 2 alpha=.25; 3 omega=pi/2; 4 phi=pi/4; 5 T=2*pi/omega; 6 tValues=(linspace(0.3*T, 200)); 7 yValues =A*exp(-alpha*tValues). *cos(omega*tValues+phi); 8 plot(tValues, yValues) 9 title('Decaying cosine wave') 10 xlabel('t') 11 ylabel('Amplitude') 12 legend('y(t)) 13 ly 9 solutions submitted (max: Unlimited) View my solutions Problem Summary Damped oscillations are commonly used to describe physical systems such as mechanical vibrations and electrical circuits. The mathematical model used to describe a damped oscillation is a cosine multiplied by an exponentionally decaying amplitude of the form: y(t) = Ae-ar cos (wt +) where A is the initial amplitude with the same units as the physical quantity that is being modeled, a is the damping constant in units of inverse seconds, w is the radian frequency of the oscillation in radians/second, t is time in seconds, and is the phase shift in radians. The period T of the wave is related to the radian frequency by the formula T= 21 Assume y(t) is a linear position measured in meters. Write a script that generates y-values for 200 equally spaced t-values spanning three periods of y(t) for a damped oscillation with the following parameter values: A = 10 m . a= 0.25 s-1 w = /2 rad/s . p = n/4 rad Assign the t values to a column vector variable tValues. Assign the y(t) values to a column vector variable yValues. Next use the plot command to generate a properly-labeled graph of y(t). Use MATLAB commands to add an appropriate title and axis labels to the figure. Solve this problem using vectorized code (i.e. use vectors and do not use a loop in your solution.) a properly-labeled graph of y(t). Use MATLAB commands to add an appropriate title and axis labels to the figure. Solve this problem using vectorized code (i.e. use vectors and do not use a loop in your solution.) Fix This Solution Best Solution My Solutions Test Results Solution 9: 2 of 6 tests passed (34%) Submitted on 17 Feb 2021 at 17:01 | ID:57522137 Size: 81 1 A=10; 2 alpha=.25; 3 omega=pi/2; 4 phi=pi/4; 5 T=2*pi/omega; 6 tValues=(linspace(0.3*T, 200)); 7 yValues =A*exp(-alpha*tValues). *cos(omega*tValues+phi); 8 plot(tValues, yValues) 9 title('Decaying cosine wave') 10 xlabel('t') 11 ylabel('Amplitude') 12 legend('y(t)) 13 ly 9 solutions submitted (max: Unlimited) View my solutions Problem Summary Damped oscillations are commonly used to describe physical systems such as mechanical vibrations and electrical circuits. The mathematical model used to describe a damped oscillation is a cosine multiplied by an exponentionally decaying amplitude of the form: y(t) = Ae-ar cos (wt +) where A is the initial amplitude with the same units as the physical quantity that is being modeled, a is the damping constant in units of inverse seconds, w is the radian frequency of the oscillation in radians/second, t is time in seconds, and is the phase shift in radians. The period T of the wave is related to the radian frequency by the formula T= 21 Assume y(t) is a linear position measured in meters. Write a script that generates y-values for 200 equally spaced t-values spanning three periods of y(t) for a damped oscillation with the following parameter values: A = 10 m . a= 0.25 s-1 w = /2 rad/s . p = n/4 rad Assign the t values to a column vector variable tValues. Assign the y(t) values to a column vector variable yValues. Next use the plot command to generate a properly-labeled graph of y(t). Use MATLAB commands to add an appropriate title and axis labels to the figure. Solve this problem using vectorized code (i.e. use vectors and do not use a loop in your solution.)