

Question: MATLAB HELP m = 2. Problem 2 - Create a MATLAB function m file, unitvector() that contains the following elements a. One input m, which
MATLAB HELP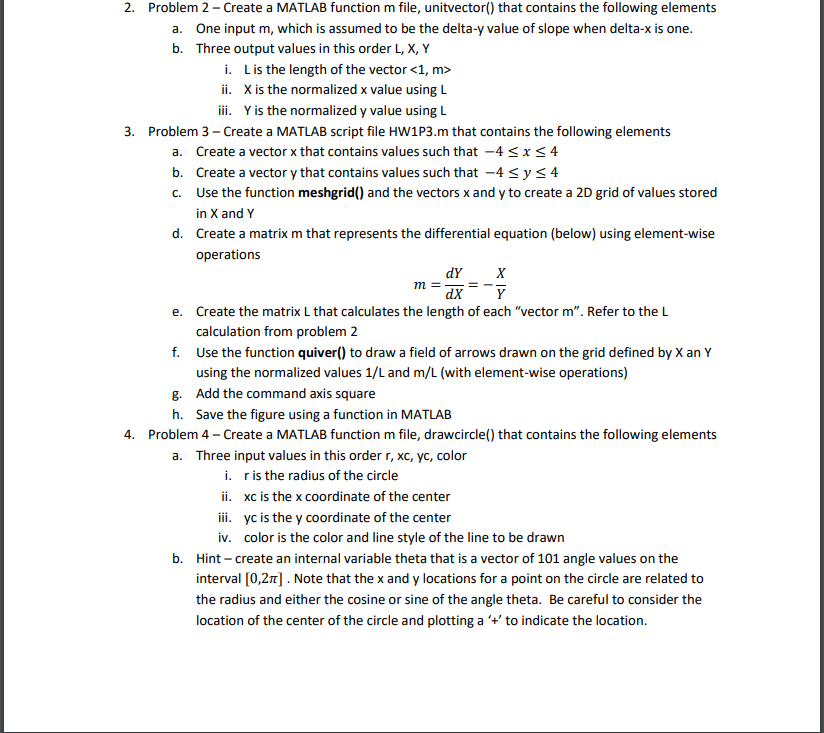
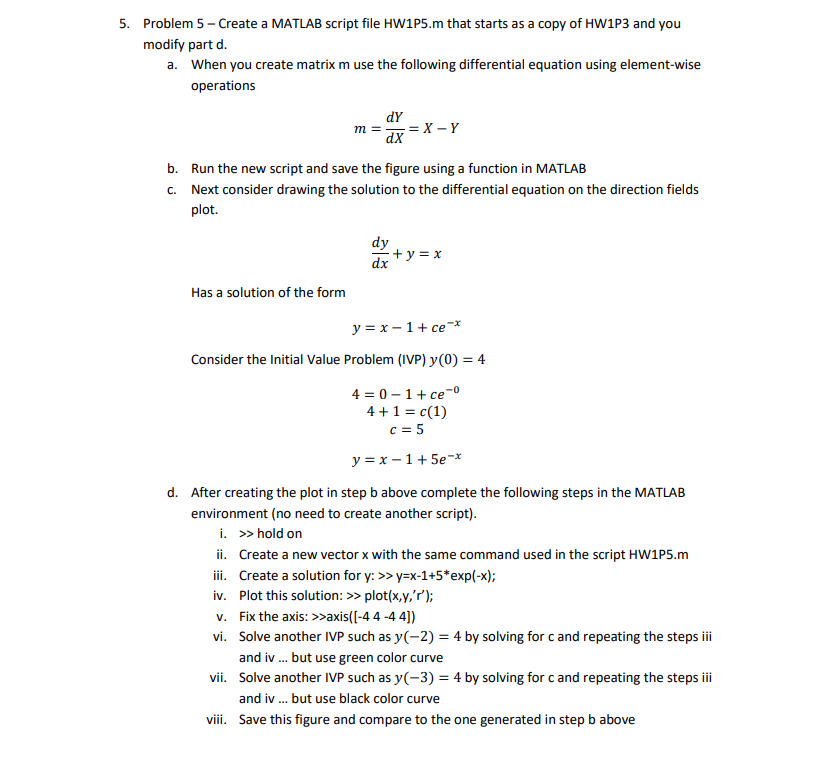
m = 2. Problem 2 - Create a MATLAB function m file, unitvector() that contains the following elements a. One input m, which is assumed to be the delta-y value of slope when delta-x is one. b. Three output values in this order L, X,Y i. Lis the length of the vector ii. X is the normalized x value using L iii. Yis the normalized y value using L 3. Problem 3 - Create a MATLAB script file HW1P3.m that contains the following elements a. Create a vector x that contains values such that -4 SXS4 b. Create a vectory that contains values such that -4 sy s4 C. Use the function meshgrid() and the vectors x and y to create a 2D grid of values stored in X and Y d. Create a matrix m that represents the differential equation (below) using element-wise operations dY X dX Y e. Create the matrix L that calculates the length of each "vector m". Refer to the L calculation from problem 2 f. Use the function quiver() to draw a field of arrows drawn on the grid defined by Xan Y using the normalized values 1/L and m/L (with element-wise operations) g. Add the command axis square h. Save the figure using a function in MATLAB 4. Problem 4 - Create a MATLAB function m file, drawcircle() that contains the following elements a. Three input values in this order r, xc, yc, color i. r is the radius of the circle ii. xc is the x coordinate of the center iii. yc is the y coordinate of the center iv. color is the color and line style of the line to be drawn b. Hint - create an internal variable theta that is a vector of 101 angle values on the interval [0,21] . Note that the x and y locations for a point on the circle are related to the radius and either the cosine or sine of the angle theta. Be careful to consider the location of the center of the circle and plotting a 't' to indicate the location. 5. Problem 5 - Create a MATLAB script file HW1P5.m that starts as a copy of HW1P3 and you modify part d. a. When you create matrix m use the following differential equation using element-wise operations dY m= dx = X-Y b. Run the new script and save the figure using a function in MATLAB c. Next consider drawing the solution to the differential equation on the direction fields plot dy dx : + y = x Has a solution of the form y = x-1+ce* Consider the Initial Value Problem (IVP) y(0) = 4 4= 0 - 1+ce- 4 + 1 = c(1) c= 5 y = x-1 +5e-* d. After creating the plot in step b above complete the following steps in the MATLAB environment (no need to create another script). i. >> hold on ii. Create a new vector x with the same command used in the script HW1P5.m iii. Create a solution for y: >>y=x-1+5*exp(-x); iv. Plot this solution: >> plot(x,y,''); v. Fix the axis: >>axis([-4 4-44]) vi. Solve another IVP such as y(-2) = 4 by solving for c and repeating the steps iii and iv ... but use green color curve vii. Solve another IVP such as y(-3) = 4 by solving for c and repeating the steps iii and iv ... but use black color curve viii. Save this figure and compare to the one generated in step b above
Step by Step Solution
There are 3 Steps involved in it

Get step-by-step solutions from verified subject matter experts