

Answered step by step
Verified Expert Solution
Question
1 Approved Answer
MATLAB HELP!! URGENT Write a MATLAB program to calculate and plot the following polynomials over the range x epsilon [-5, 5]. f_1(1) = x^2 f_2(x)
MATLAB HELP!! URGENT
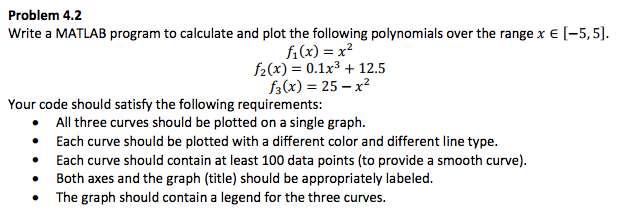
Write a MATLAB program to calculate and plot the following polynomials over the range x epsilon [-5, 5]. f_1(1) = x^2 f_2(x) = 0.1x^3 + 12.5 f_3(x)= 25-x Your code should satisfy the following requirements: bullet All three curves should be plotted on a single graph. Each curve should be plotted with a different color and different line type. Each curve should contain at least 100 data points (to provide a smooth curve). Both axes and the graph (title) should be appropriately labeled. The graph should contain a legend for the three curvesStep by Step Solution
There are 3 Steps involved in it
Step: 1

Get Instant Access to Expert-Tailored Solutions
See step-by-step solutions with expert insights and AI powered tools for academic success
Step: 2

Step: 3
Ace Your Homework with AI
Get the answers you need in no time with our AI-driven, step-by-step assistance
Get Started
Database Reliability Engineering Designing And Operating Resilient Database Systems
Authors: Laine Campbell, Charity Majors
1st Edition
978-1491925942