MATLAB HELP

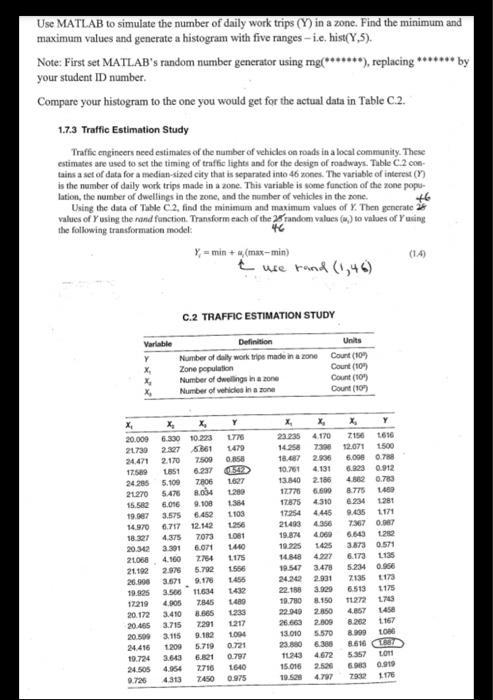
Use MATLAB to simulate the number of daily work trips (Y) in a zone. Find the minimum and maximum values and generate a histogram with five ranges -i.c. hist(Y,5). Note: First set MATLAB's random number generator using mg*******), replacing ******* by your student ID number Compare your histogram to the one you would get for the actual data in Table C.2. 1.7.3 Traffic Estimation Study Traffic engineers need estimates of the number of vehicles on roads in a local community. These estimates are used to set the timing of traffic lights and for the design of roadways. Table C 2.0 tains a set of data for a median-sized city that is separated into 46 ones. The variable of interest is the number of daily work trips made in a zone. This variable is some function of the zone popu- lation, the number of dwellings in the zone, and the number of vehicles in the zone. +6 Using the data of Table C 2. find the minimum and maximum values of Y. Then generate values of using the rond function. Transform each of the random values (m) to values of Yusing the following transformation model: 46 Y = min+ ,(max-min) (1.4 use rand (1,46) C.2 TRAFFIC ESTIMATION STUDY Variable Y Definition Units Number of daily work trip made in azone Count (10) Zone population Count(109 Number of dwellings in a con Count(109) Number of whicles in one Court (10) X x Y 1776 1479 0.858 1627 1.200 1171 X X X 20.000 6.390 10.223 21730 2.327 6.661 24.471 2.170 7500 17:58 1851 6.237 24 205 5.100 72806 21270 5.476 8094 15.582 6.016 2.100 19.987 3.575 6.452 14.970 6.717 12.142 4.375 7073 20.342 6.071 21.068 4.160 21.192 2.976 5.792 26.900 3.500 11634 17219 4.905 7.845 20.172 3.410 8.665 20.465 2.715 7291 20.500 3115 9.182 24.416 1200 5.719 10.724 3.643 6.821 24.505 4.954 7710 0.726 4313 7450 1384 1103 1256 1.081 1440 1.175 X 23.235 4170 14258 7300 18.687 2.900 10.701 4.131 13.840 2.186 6.600 17875 4310 17.254 4.445 21493 4.356 19.874 4.000 1.425 14.848 4.27 19.547 3.470 24.242 2.931 22.188 3.920 10.780 150 22.049 2.850 26.663 2.500 13.010 5570 23.880 6.380 14243 4.672 15.016 4.77 X Y 7150 1616 12.071 1500 6.000 0.78 6.923 0.912 4.80 0.783 8.775 1450 6234 1280 9.435 7307 0.087 6.663 22 3.873 0.571 6.173 1135 5234 0.956 7135 173 6.513 1175 11272 179 4.857 14 8.202 LONG 8.616 C 5357 LON 0.919 2932 1178 9.178 1456 14 1235 167 1.217 1.000 0.721 0.797 1640 0.975 Use MATLAB to simulate the number of daily work trips (Y) in a zone. Find the minimum and maximum values and generate a histogram with five ranges -i.c. hist(Y,5). Note: First set MATLAB's random number generator using mg*******), replacing ******* by your student ID number Compare your histogram to the one you would get for the actual data in Table C.2. 1.7.3 Traffic Estimation Study Traffic engineers need estimates of the number of vehicles on roads in a local community. These estimates are used to set the timing of traffic lights and for the design of roadways. Table C 2.0 tains a set of data for a median-sized city that is separated into 46 ones. The variable of interest is the number of daily work trips made in a zone. This variable is some function of the zone popu- lation, the number of dwellings in the zone, and the number of vehicles in the zone. +6 Using the data of Table C 2. find the minimum and maximum values of Y. Then generate values of using the rond function. Transform each of the random values (m) to values of Yusing the following transformation model: 46 Y = min+ ,(max-min) (1.4 use rand (1,46) C.2 TRAFFIC ESTIMATION STUDY Variable Y Definition Units Number of daily work trip made in azone Count (10) Zone population Count(109 Number of dwellings in a con Count(109) Number of whicles in one Court (10) X x Y 1776 1479 0.858 1627 1.200 1171 X X X 20.000 6.390 10.223 21730 2.327 6.661 24.471 2.170 7500 17:58 1851 6.237 24 205 5.100 72806 21270 5.476 8094 15.582 6.016 2.100 19.987 3.575 6.452 14.970 6.717 12.142 4.375 7073 20.342 6.071 21.068 4.160 21.192 2.976 5.792 26.900 3.500 11634 17219 4.905 7.845 20.172 3.410 8.665 20.465 2.715 7291 20.500 3115 9.182 24.416 1200 5.719 10.724 3.643 6.821 24.505 4.954 7710 0.726 4313 7450 1384 1103 1256 1.081 1440 1.175 X 23.235 4170 14258 7300 18.687 2.900 10.701 4.131 13.840 2.186 6.600 17875 4310 17.254 4.445 21493 4.356 19.874 4.000 1.425 14.848 4.27 19.547 3.470 24.242 2.931 22.188 3.920 10.780 150 22.049 2.850 26.663 2.500 13.010 5570 23.880 6.380 14243 4.672 15.016 4.77 X Y 7150 1616 12.071 1500 6.000 0.78 6.923 0.912 4.80 0.783 8.775 1450 6234 1280 9.435 7307 0.087 6.663 22 3.873 0.571 6.173 1135 5234 0.956 7135 173 6.513 1175 11272 179 4.857 14 8.202 LONG 8.616 C 5357 LON 0.919 2932 1178 9.178 1456 14 1235 167 1.217 1.000 0.721 0.797 1640 0.975


