

Question
***MATLAB** I need help plotting my direction field. I keep getting an error of Too many input arguments. Error (line 227) [t,y1] = ode23(@(t,y) loveRJ(t,y,b1,c1,k1,b2,c2,k2),tspan,y0_1);
***MATLAB** I need help plotting my direction field. I keep getting an error of Too many input arguments.
Error (line 227) [t,y1] = ode23(@(t,y) loveRJ(t,y,b1,c1,k1,b2,c2,k2),tspan,y0_1);
Error in odearguments (line 92) f0 = ode(t0,y0,args{:}); % ODE15I sets args{1} to yp0.
Error in ode23 (line 106) odearguments(odeIsFuncHandle, odeTreatAsMFile, solver_name, ode, tspan, y0, options, varargin);
Error in DiscussionSection5 (line 227) [t,y1] = ode23(@(t,y) loveRJ(t,y,b1,c1,k1,b2,c2,k2),tspan,y0_1);
my code is:
% |meshgrid| creates two matrices: one for all the uu-values of the grid, and
% one for all the vv-values of the grid. Then, we consider |x1| and |x2|
% matrices: |x1| will contain the value of |y1'| at each uu and vv position,
% while |x2| will contain the value of |y2'| at each uu and vv position of
% our grid.
[uu,vv] = meshgrid(y2,y1);
x1 = zeros(size(uu));
x2 = zeros(size(vv));
%%
% Now we compute the vector field and plot the phase
% portrait. Our derivatives are computed for each point (y1, y2) at
% |init_time = 0|, through a |for| loop. We have obtained the phase
% portrait.
b1 = 0.5;
c1 = 2;
k1 = 15;
b2= 2;
c2 = 0.5;
k2 = 15;
init_time=0;
loveRJ = @(t,y) [b1*y(2)*y(1) + c1*y(1)*(1-(y(1)/k1)); b2*y(2)*y(1) + c2*y(2)*(1-(y(2)/k2))];
for i = 1:numel(uu)
Yder = loveRJ(init_time,[uu(i); vv(i)]);
x1(i) = Yder(1);
x2(i) = Yder(2);
end
%%
% Finally we compute a couple of solutions and plot them, along with the phase
% portrait, on the phase plane.
figure
quiver(gca,uu,vv,x1,x2,'r');
xlabel('Juliet Emotions');
ylabel('Romeo Emotions');
axis tight equal;
% Calculate and plot 1st Solution
tstart = 0;
tfinal = 50;
tspan = [tstart tfinal];
y0_1 = [2;-1]; % initial conditions
[t,y1] = ode23(@(t,y) loveRJ(t,y,b1,c1,k1,b2,c2,k2),tspan,y0_1);
figure(gcf)
hold on
plot(y1(:,2),y1(:,1),'b')
plot(y1(1,2),y1(1,1),'mo',... % starting point
'MarkerEdgeColor','k',...
'MarkerFaceColor',[.49 1 .63],...
'MarkerSize',10)
plot(y1(end,2),y1(end,1),'bs',... % ending point
'MarkerEdgeColor','k',...
'MarkerFaceColor',[.49 .63 1],...
'MarkerSize',10)
% Calculate 2nd Solution
y0_2 = [4;1]; % initial conditions
[t,y2] = ode23(@(t,y) loveRJ(t,y,b1,c1,k1,b2,c2,k2),tspan,y0_2);
plot(y2(:,2),y2(:,1),'c')
plot(y2(1,2),y2(1,1),'ko',... % starting point
'MarkerEdgeColor','k',...
'MarkerFaceColor',[.49 1 .63],...
'MarkerSize',10)
plot(y2(end,2),y2(end,1),'bs',... % ending point
'MarkerEdgeColor','k',...
'MarkerFaceColor',[.49 .63 1],...
'MarkerSize',10)
% Calculate 3rd Solution
y0_3 = [5;2]; % initial conditions
[t,y3] = ode23(@(t,y) loveRJ(t,y,b1,c1,k1,b2,c2,k2),tspan,y0_3);figure(gcf)
plot(y3(:,2),y3(:,1),'c')
plot(y3(1,2),y3(1,1),'ko',... % starting point
'MarkerEdgeColor','k',...
'MarkerFaceColor',[.49 1 .63],...
'MarkerSize',10)
plot(y3(end,2),y3(end,1),'bs',... % ending point
'MarkerEdgeColor','k',...
'MarkerFaceColor',[.49 .63 1],...
'MarkerSize',10)
hold off
title("solutions plotted on vector field")
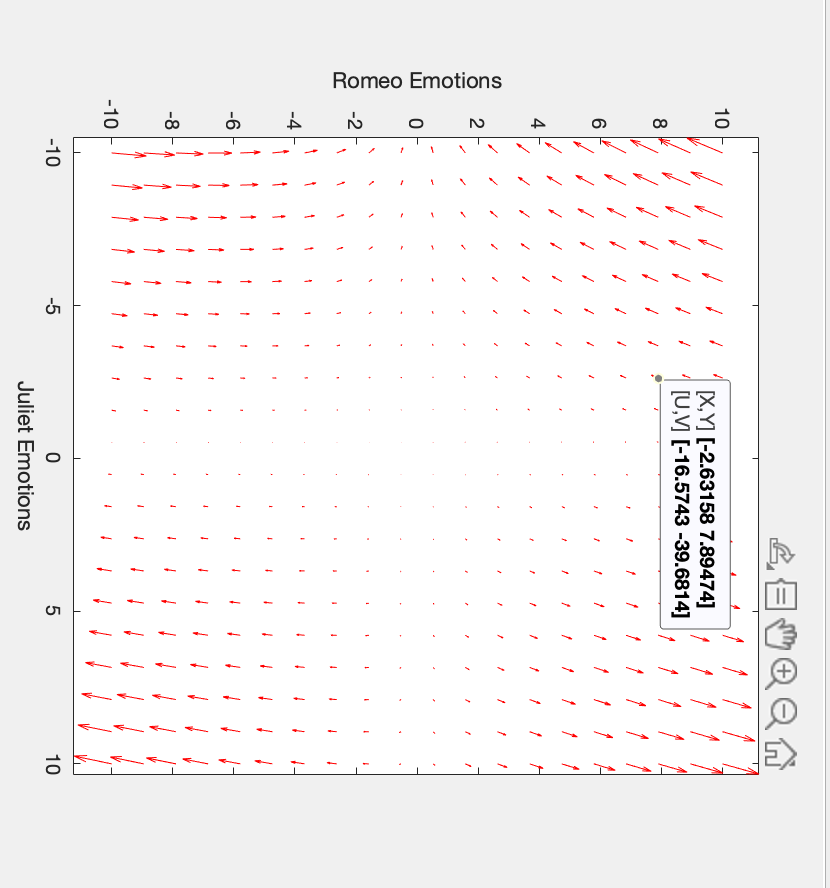
and this is the plot i keep getting.
Step by Step Solution
There are 3 Steps involved in it
Step: 1

Get Instant Access to Expert-Tailored Solutions
See step-by-step solutions with expert insights and AI powered tools for academic success
Step: 2

Step: 3
Ace Your Homework with AI
Get the answers you need in no time with our AI-driven, step-by-step assistance
Get Started
Select Healthcare Classification Systems And Databases
Authors: Katherine S. Rowell, Ann Cutrell
1st Edition
0615909760, 978-0615909769