

Answered step by step
Verified Expert Solution
Question
1 Approved Answer
MATLAB II. Use a for loop to plot the function given below over the interval 5x20. Properly label the plot. The variable y represents height
MATLAB 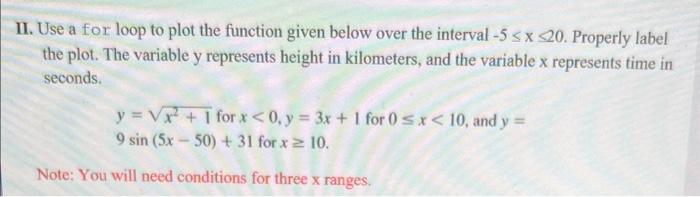
II. Use a for loop to plot the function given below over the interval 5x20. Properly label the plot. The variable y represents height in kilometers, and the variable x represents time in seconds. y=x2+1forx Step by Step Solution
There are 3 Steps involved in it
Step: 1

Get Instant Access to Expert-Tailored Solutions
See step-by-step solutions with expert insights and AI powered tools for academic success
Step: 2

Step: 3
Ace Your Homework with AI
Get the answers you need in no time with our AI-driven, step-by-step assistance
Get Started
Database Systems Introduction To Databases And Data Warehouses
Authors: Nenad Jukic, Susan Vrbsky, Svetlozar Nestorov
1st Edition
1943153191, 978-1943153190