Answered step by step
Verified Expert Solution
Question
1 Approved Answer
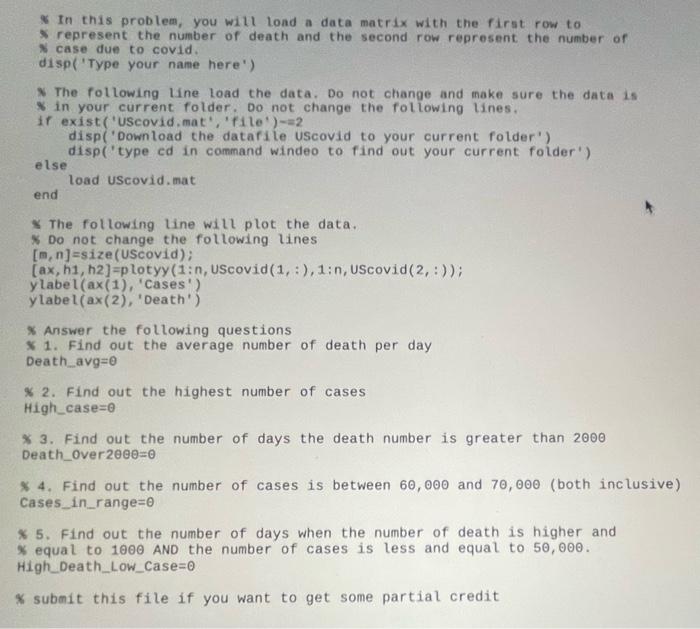
Matlab * In this problem, you will load a data matrix with the first row to 3. represent the number of death and the second
Matlab 

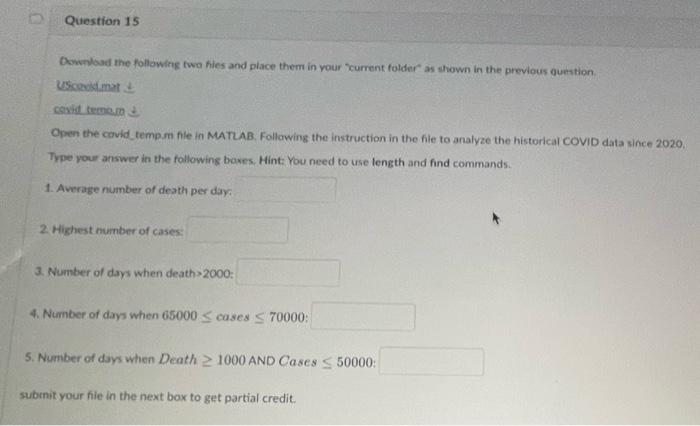
* In this problem, you will load a data matrix with the first row to 3. represent the number of death and the second row represent the number of 8 case due to covid. disp('Type your name here') The following line load the data. Do not change and thake sure the data is in your current folder. Do not change the following lines. if exist ("Uscovid, mat', "file') =2 disp('Download the datafile uscovid to your current folder') disp('type ed in command windeo to find out your current folder') else load UScovid, mat end * The following line will plot the data. * Do not change the following lines [m,n]=size( UScovid); [ax,h1,h2]=pLotyy(1:n, UScovid (1,:),1:n, UScovid (2,:)) ylabel (ax(1),1 cases ) y label (ax(2), 'Death') * Answer the following questions * 1. Find out the average number of death per day Death_avg =0 \% 2. Find out the highest number of cases High case=0 4 3. Find out the number of days the death number is greater than 2000 Death_over 200=0 * 4. Find out the number of cases is between 60,000 and 70,000 (both inclusive Cases_in_range =0 * 5. Find out the number of days when the number of death is higher and \% equal to 1000 AND the number of cases is less and equal to 50,000. High_Death_Low_Case =0 * submit this file if you want to get some partial credit Downliad the following two hies and place them in vour 'current folder as shown in the previous guestion. uscovidimat t cosid temam in Open the covid temp.m fle in MATLAB. Following the instruction in the file to analyze the historical COVID data since 2020. Trpe your answer in the following baxes. Hint: You need to use length and find commands. 1. Average number of death per daya 2. Highest number of cases: 3. Number of days when death >2000 : Number of days when 65000 cases 70000: Number of days when Death 1000 AND Cases 50000 : onit your file in the next box to get partial credit. * In this problem, you will load a data matrix with the first row to 3. represent the number of death and the second row represent the number of 8 case due to covid. disp('Type your name here') The following line load the data. Do not change and thake sure the data is in your current folder. Do not change the following lines. if exist ("Uscovid, mat', "file') =2 disp('Download the datafile uscovid to your current folder') disp('type ed in command windeo to find out your current folder') else load UScovid, mat end * The following line will plot the data. * Do not change the following lines [m,n]=size( UScovid); [ax,h1,h2]=pLotyy(1:n, UScovid (1,:),1:n, UScovid (2,:)) ylabel (ax(1),1 cases ) y label (ax(2), 'Death') * Answer the following questions * 1. Find out the average number of death per day Death_avg =0 \% 2. Find out the highest number of cases High case=0 4 3. Find out the number of days the death number is greater than 2000 Death_over 200=0 * 4. Find out the number of cases is between 60,000 and 70,000 (both inclusive Cases_in_range =0 * 5. Find out the number of days when the number of death is higher and \% equal to 1000 AND the number of cases is less and equal to 50,000. High_Death_Low_Case =0 * submit this file if you want to get some partial credit Downliad the following two hies and place them in vour 'current folder as shown in the previous guestion. uscovidimat t cosid temam in Open the covid temp.m fle in MATLAB. Following the instruction in the file to analyze the historical COVID data since 2020. Trpe your answer in the following baxes. Hint: You need to use length and find commands. 1. Average number of death per daya 2. Highest number of cases: 3. Number of days when death >2000 : Number of days when 65000 cases 70000: Number of days when Death 1000 AND Cases 50000 : onit your file in the next box to get partial credit 

Step by Step Solution
There are 3 Steps involved in it
Step: 1

Get Instant Access to Expert-Tailored Solutions
See step-by-step solutions with expert insights and AI powered tools for academic success
Step: 2

Step: 3

Ace Your Homework with AI
Get the answers you need in no time with our AI-driven, step-by-step assistance
Get Started


