

Answered step by step
Verified Expert Solution
Question
1 Approved Answer
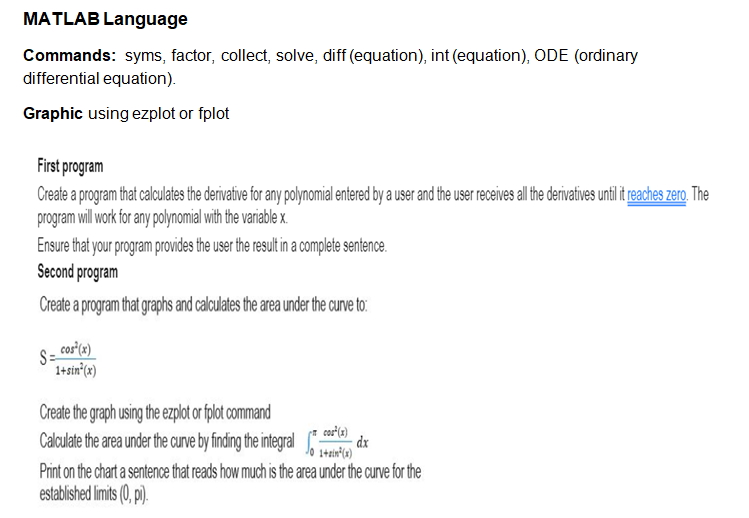
MATLAB Language Commands: syms, factor, collect, solve, diff(equation), int (equation), ODE (ordinary differential equation). Graphic using ezplot or fplot First program Create a program that
Step by Step Solution
There are 3 Steps involved in it
Step: 1

Get Instant Access to Expert-Tailored Solutions
See step-by-step solutions with expert insights and AI powered tools for academic success
Step: 2

Step: 3
Ace Your Homework with AI
Get the answers you need in no time with our AI-driven, step-by-step assistance
Get Started
Lncs 8999 Databases In Networked Information Systems 10th International Workshop Dnis 2015 Aizu Wakamatsu Japan March 23 25 2015 Proceedings
Authors: Wanming Chu ,Shinji Kikuchi ,Subhash Bhalla
2015th Edition
3319163124, 978-3319163123