Answered step by step
Verified Expert Solution
Link Copied!

Question

1 Approved Answer

Matlab least square fit Consider the data: a. Find and display the equation of the least squares best fit line for the data (x, y).

Matlab least square fit image text in transcribed
Consider the data: a. Find and display the equation of the least squares "best fit" line for the data (x, y). b. Plot the original discrete data (x, y) using red 'o' symbols and the best-fit line in black on a single plot, using. c. Find and display the equation of the least squares "best fit" cubic equation for the data (x, z). d. Below the plot of part (b), plot the original discrete data (x, z) using green 'X' and the best-fit cubic function on a single plot, using values for x between 0 and 6, with increments of 0.1

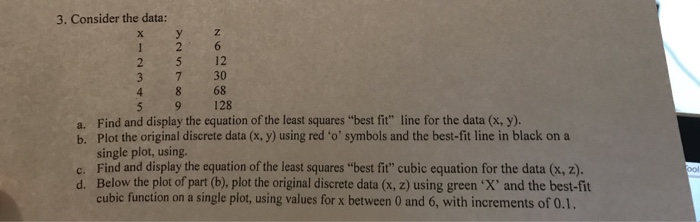
Step by Step Solution

There are 3 Steps involved in it

Step: 1

blur-text-image

Get Instant Access to Expert-Tailored Solutions

See step-by-step solutions with expert insights and AI powered tools for academic success

Step: 2

blur-text-image

Step: 3

blur-text-image

Ace Your Homework with AI

Get the answers you need in no time with our AI-driven, step-by-step assistance

Get Started

Recommended Textbook for

Oracle Autonomous Database In Enterprise Architecture

Authors: Bal Mukund Sharma, Krishnakumar KM, Rashmi Panda

1st Edition

1801072248, 978-1801072243

More Books

Students also viewed these Databases questions

Question

What are Measures in OLAP Cubes?

Answered: 1 week ago

Question

How do OLAP Databases provide for Drilling Down into data?

Answered: 1 week ago

Question

How are OLAP Cubes different from Production Relational Databases?

Answered: 1 week ago