MATLAB
 MATLAB
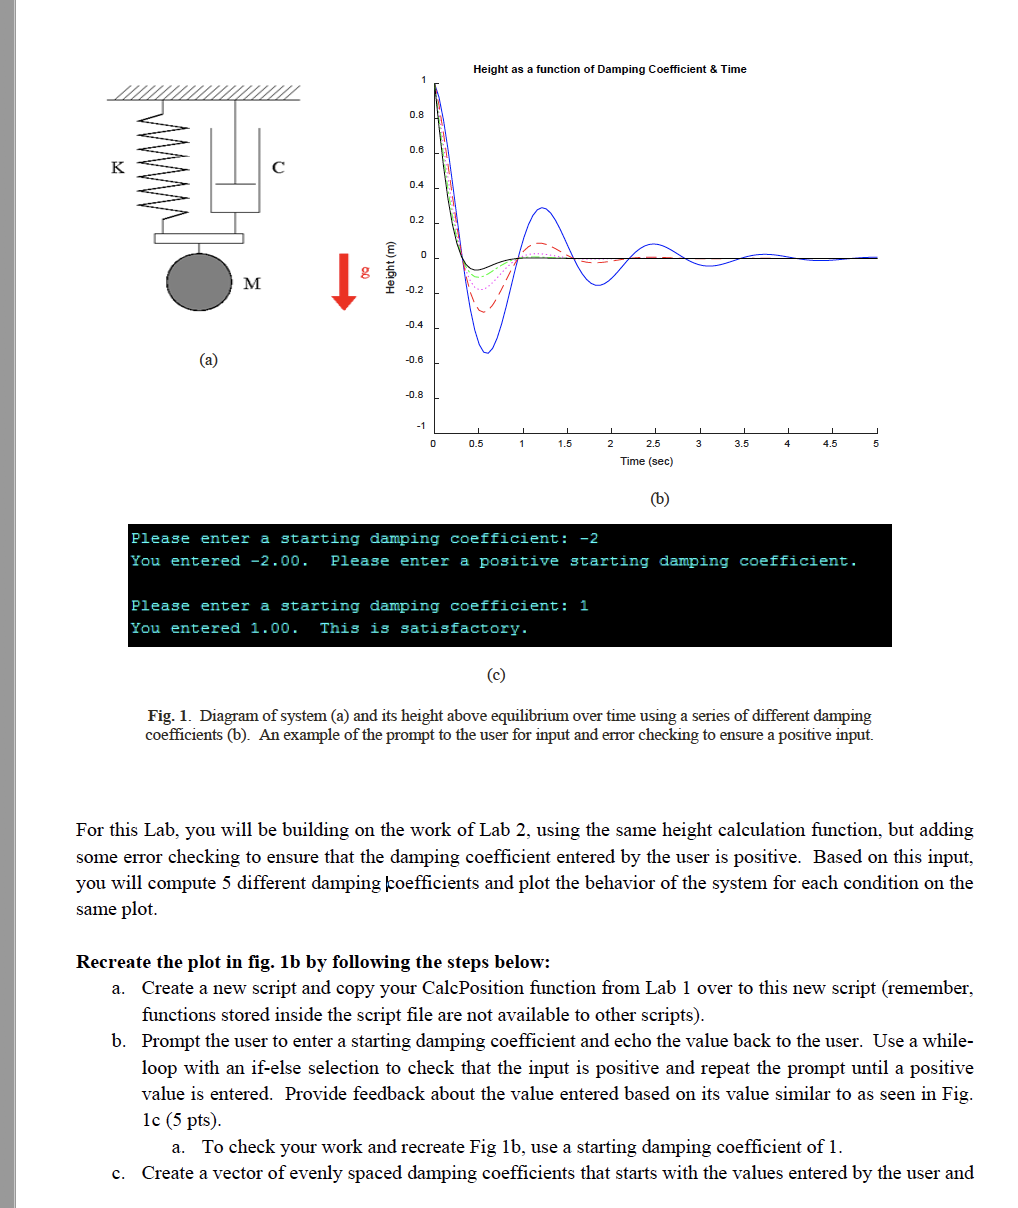
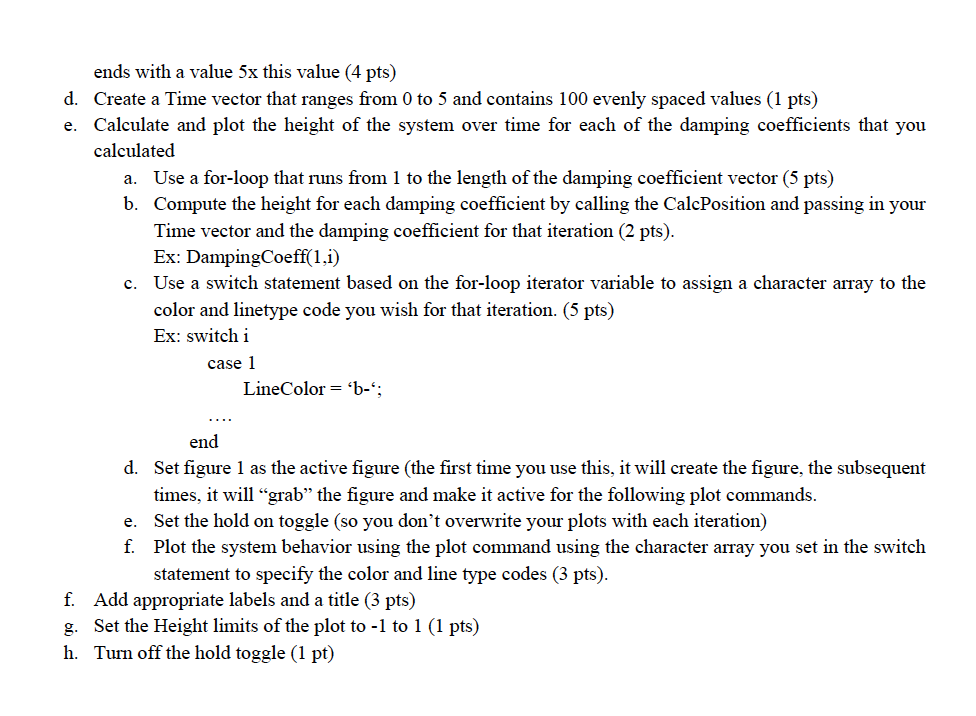
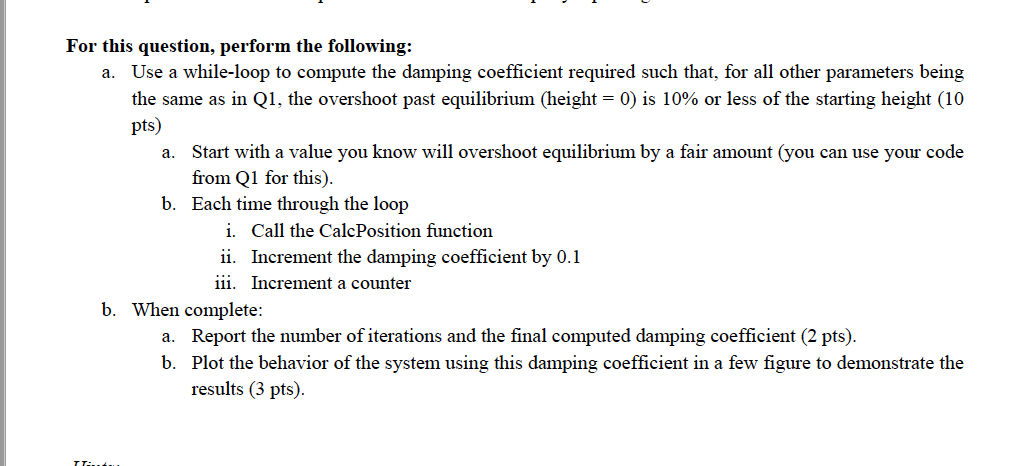
QUESTIONS There are 2 questions for this lab. 1. PLOTTING REPEATED BEHAVIORS (30 PTS) The spring-mass-damper system shown in fig. la, will behave over time as shown in fig. 1b when released from a particular height above its rest point as governed by the equation in eq. 1. H = e-yta cos(wt) (eq. 1) Where H is the height above rest, y is the damping coefficient, a is the starting height before release, o is the frequency of oscillation, and t is the time from release. For this exercise: The damping coefficient will be variable and computed from input by the user. t will be a vector of values from 0 to 5 seconds a=1 0 = 5. The highlighted values are different from Lab 1 Height as a function of Damping Coefficient & Time Height (m) 00 0 0.5 1 1.5 2 3 3.5 4 4.5 5 2.5 Time (sec) (6) Please enter a starting damping coefficient: -2 You entered -2.00. Please enter a positive starting damping coefficient. Please enter a starting damping coefficient: 1 You entered 1.00. This is satisfactory. Fig. 1. Diagram of system (a) and its height above equilibrium over time using a series of different damping coefficients (b). An example of the prompt to the user for input and error checking to ensure a positive input. For this Lab, you will be building on the work of Lab 2, using the same height calculation function, but adding some error checking to ensure that the damping coefficient entered by the user is positive. Based on this input, you will compute 5 different damping coefficients and plot the behavior of the system for each condition on the same plot. Recreate the plot in fig. 1b by following the steps below: a. Create a new script and copy your CalcPosition function from Lab 1 over to this new script (remember, functions stored inside the script file are not available to other scripts). b. Prompt the user to enter a starting damping coefficient and echo the value back to the user. Use a while- loop with an if-else selection to check that the input is positive and repeat the prompt until a positive value is entered. Provide feedback about the value entered based on its value similar to as seen in Fig. 1c (5 pts). a. To check your work and recreate Fig 1b, use a starting damping coefficient of 1. c. Create a vector of evenly spaced damping coefficients that starts with the values entered by the user and ends with a value 5x this value (4 pts) d. Create a Time vector that ranges from 0 to 5 and contains 100 evenly spaced values (1 pts) e. Calculate and plot the height of the system over time for each of the damping coefficients that you calculated a. Use a for-loop that runs from 1 to the length of the damping coefficient vector (5 pts) b. Compute the height for each damping coefficient by calling the CalcPosition and passing in your Time vector and the damping coefficient for that iteration (2 pts). Ex: DampingCoeff(1.1) c. Use a switch statement based on the for-loop iterator variable to assign a character array to the color and linetype code you wish for that iteration. (5 pts) Ex: switch i case 1 LineColor = 'b-"; end d. Set figure 1 as the active figure (the first time you use this, it will create the figure, the subsequent times, it will "grab the figure and make it active for the following plot commands. e. Set the hold on toggle (so you don't overwrite your plots with each iteration) f. Plot the system behavior using the plot command using the character array you set in the switch statement to specify the color and line type codes (3 pts). f. Add appropriate labels and a title (3 pts) g. Set the Height limits of the plot to -1 to 1 (1 pts) h. Turn off the hold toggle (1 pt) For this question, perform the following: a. Use a while-loop to compute the damping coefficient required such that, for all other parameters being the same as in Q1, the overshoot past equilibrium (height = 0) is 10% or less of the starting height (10 pts) a. Start with a value you know will overshoot equilibrium by a fair amount (you can use your code from Q1 for this). b. Each time through the loop i. Call the CalcPosition function ii. Increment the damping coefficient by 0.1 iii. Increment a counter b. When complete: a. Report the number of iterations and the final computed damping coefficient (2 pts). b. Plot the behavior of the system using this damping coefficient in a few figure to demonstrate the results (3 pts)