Question
** MATLAB ONLY My Code so far x_maze = [ x_maze(1:6) x_maze+35 x_maze(7:12)]; y_maze = [ y_maze(1:6) y_maze+10 y_maze(7:12)]; f1 = figure(); mymap = [spring];
** MATLAB ONLY

My Code so far
x_maze = [ x_maze(1:6) x_maze+35 x_maze(7:12)];
y_maze = [ y_maze(1:6) y_maze+10 y_maze(7:12)];
f1 = figure();
mymap = [spring];
colormap(mymap);
Cfill = rand(size(x_maze));
fill(x_maze, y_maze, Cfill, 'LineWidth', 2, 'EdgeColor', 'red')
hold on
ax = gca; ax.Color = [0, 0, 0.4]; % dark blue background
axis equal tight
axis([-5, 65, -5, 40])
hold on
pacman_handle = fill(pacman(1,:),pacman(2,:),'y', 'LineWidth', 2);
blue_jewel_handle= plot(49,22.5,'d', 'MarkerFaceColor','b');
hold on
TP = [22.5 22.5 2.5 2.5
2.5 22.5 22.5 12.5];
TP=[TP TP + [35;10];
plot(TP,'*','y','markersize', 14) %what I need help with
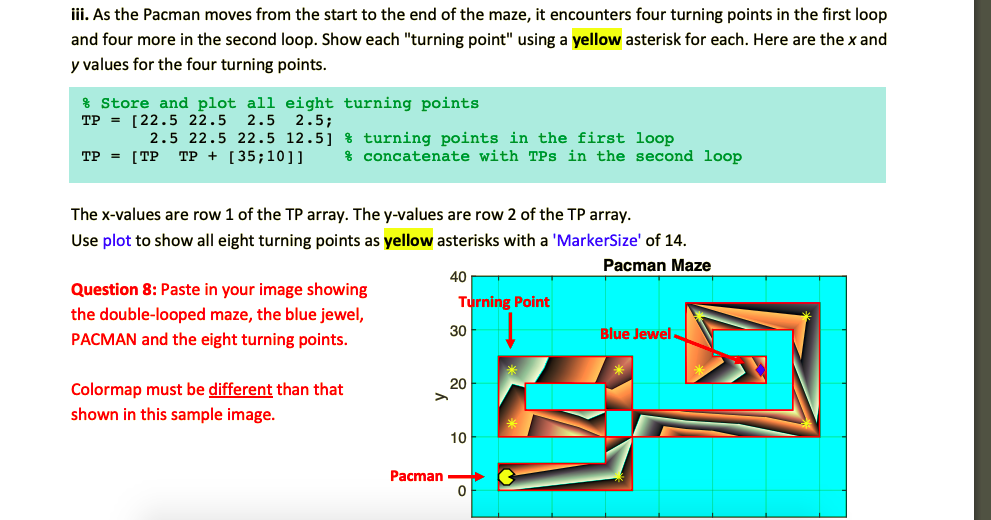
iii. As the Pacman moves from the start to the end of the maze, it encounters four turning points in the first loop and four more in the second loop. Show each "turning point" using a yellow asterisk for each. Here are the x and y values for the four turning points % store and plot all eight turning points TP[22.5 22.5 2.5 2.5; 2.5 22.5 22.5 12.5) % turning points in the first loop TP[TP TP + [35;10]] % concatenate with TPs in the second loop The x-values are row 1 of the TP array. The y-values are row 2 of the TP array Use plot to show all eight turning points as yellow asterisks with a 'MarkerSize' of 14 Pacman Maze 40 Question 8: Paste in your image showing the double-looped maze, the blue jewel, PACMAN and the eight turning points. Turning Point 30 Blue Jewel 20 Colormap must be different than that shown in this sample image 10 Pacman iii. As the Pacman moves from the start to the end of the maze, it encounters four turning points in the first loop and four more in the second loop. Show each "turning point" using a yellow asterisk for each. Here are the x and y values for the four turning points % store and plot all eight turning points TP[22.5 22.5 2.5 2.5; 2.5 22.5 22.5 12.5) % turning points in the first loop TP[TP TP + [35;10]] % concatenate with TPs in the second loop The x-values are row 1 of the TP array. The y-values are row 2 of the TP array Use plot to show all eight turning points as yellow asterisks with a 'MarkerSize' of 14 Pacman Maze 40 Question 8: Paste in your image showing the double-looped maze, the blue jewel, PACMAN and the eight turning points. Turning Point 30 Blue Jewel 20 Colormap must be different than that shown in this sample image 10 PacmanStep by Step Solution
There are 3 Steps involved in it
Step: 1

Get Instant Access to Expert-Tailored Solutions
See step-by-step solutions with expert insights and AI powered tools for academic success
Step: 2

Step: 3

Ace Your Homework with AI
Get the answers you need in no time with our AI-driven, step-by-step assistance
Get Started


