Answered step by step
Verified Expert Solution
Question
1 Approved Answer
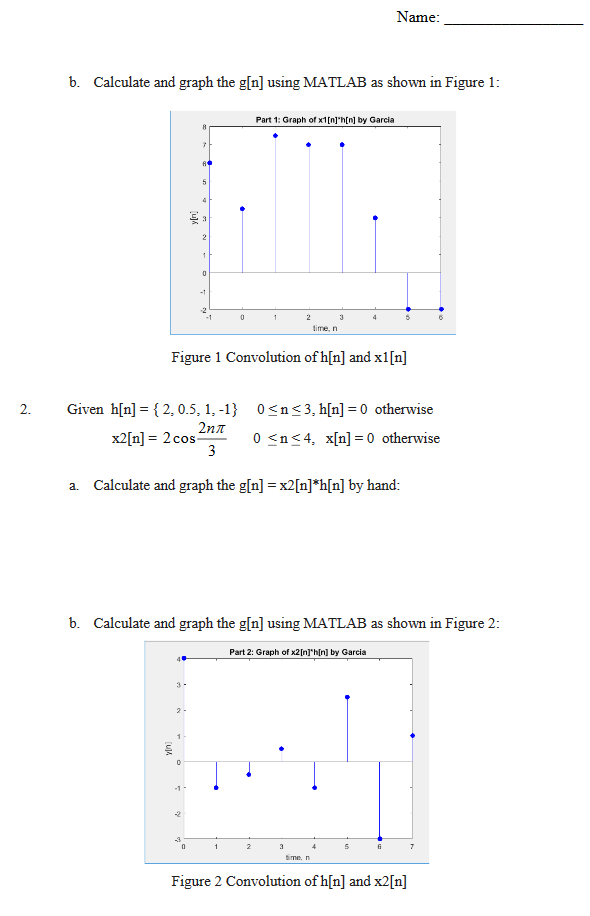
Matlab Only Spring 2019 I. OBJECTIVES Find and graph convolution of two signals. . EQUIPMENT AND MATERIALS Computer with MATLAB III. INTRODUCTION For a Linear
Matlab Only
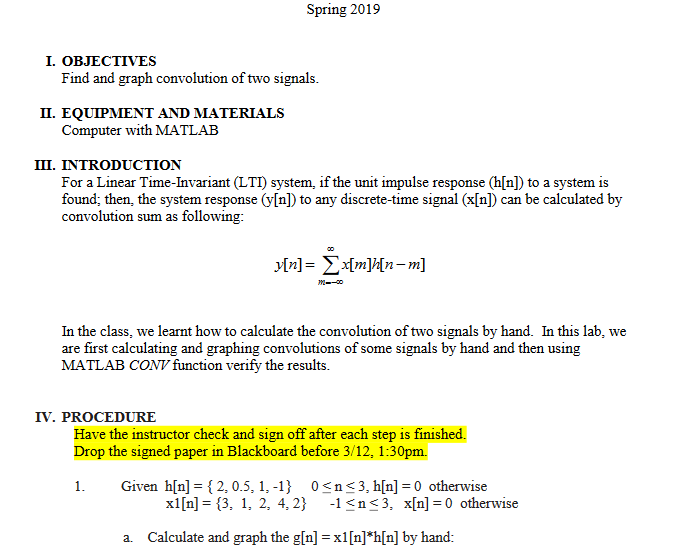
Spring 2019 I. OBJECTIVES Find and graph convolution of two signals. . EQUIPMENT AND MATERIALS Computer with MATLAB III. INTRODUCTION For a Linear Time-Invariant (LTI) system, if the unit impulse response (h[n]) to a system is found, then, the system response (v[n]) to any discrete-time signal (x[n can be calculated by convolution sum as following: In the class, we learnt how to calculate the convolution of two signals by hand. In this lab, we are first calculating and graphing convolutions of some signals by hand and then using MATLAB CONV function verify the results. IV. PROCEDURE Have the instructor check and sign off after each step is finished. Drop the signed paper in Blackboard before 3/12, 1:30pm. 1 Given h[n] 2,0.5, 1,-1 0Sns3, h[n]-0 otherwise x1[n 3, 1, 2, 4,2 1Sn3, xln] 0 otherwise a. Calculate and graph the g[n]-xl[n] hn] by hand Name:_ b. Calculate and graph the gln] using MATLAB as shown in Figure 1 Part 1: Graph of x1[n]'h[n] by Garcia .2 time, n Figure 1 Convolution of h[n] and x1[n 2. Given h[n]2, 0.5, 1,-10Sns3, h[n]-0 otherwise 2nT x2[n] 2cos0 Sn4, xIn]0 otherwise a. Calculate and graph the g[n] x2n]*h[n] by hand: b. Calculate and graph the gln] using MATLAB as shown in Figure 2: Part 2: Graph of x2[n]'hIn] by Garcia time, n Figure 2 Convolution of h[n] and x2[n]Step by Step Solution
There are 3 Steps involved in it
Step: 1
Get Instant Access to Expert-Tailored Solutions
See step-by-step solutions with expert insights and AI powered tools for academic success
Step: 2
Step: 3
Ace Your Homework with AI
Get the answers you need in no time with our AI-driven, step-by-step assistance
Get Started