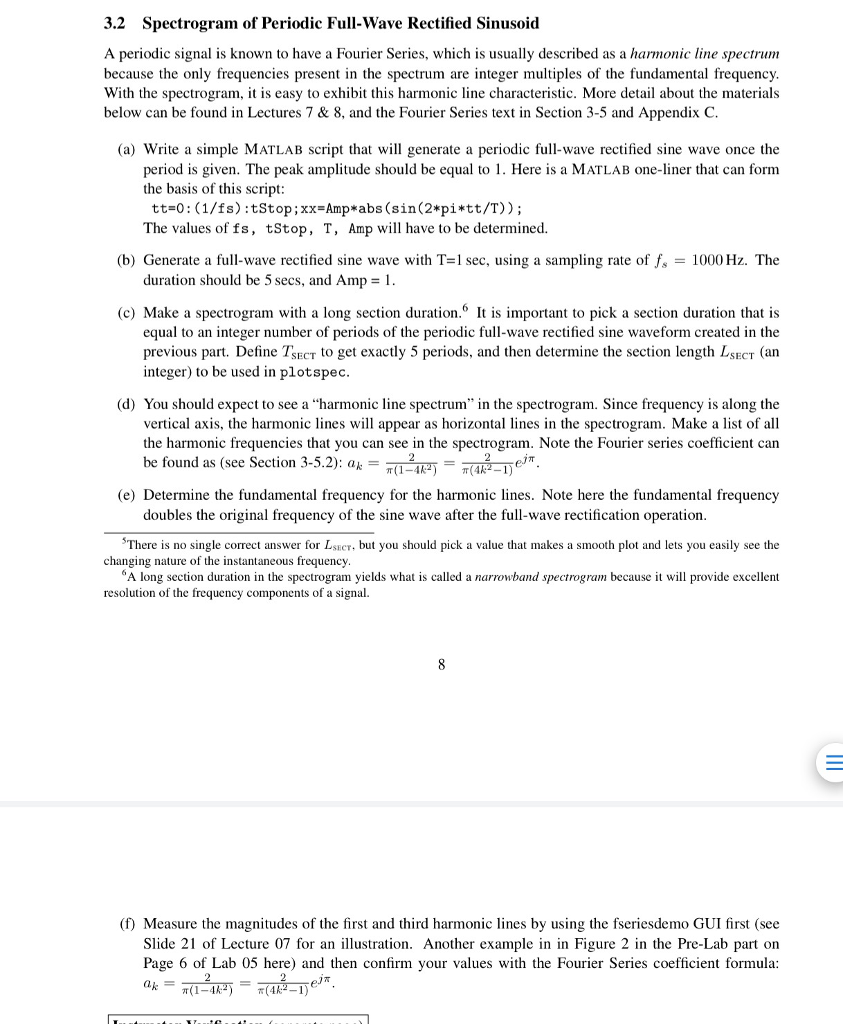
MATLAB. PLEASE COMPLETE ALL PARTS A THROUGH F. FOR PART A SHOW YOUR MATLAB SCRIPT. FOR PART B WHAT IS THE VALUE OF TSECT AND LSECT. FOR PART C SHOW CODE FOR SPECTROGRAM. FOR PART D LIST FREQUENCIES OF VISIBLE HARMONICS. FOR PART E WHAT IS THE FUNDAMENTAL FREQUENCY. FOR PART F MEASURE THE MAGNITUDES AND DB DIFFERENCE.

3.2 Spectrogram of Periodic Full-Wave Rectified Sinusoid A periodic signal is known to have a Fourier Series, which is usually described as a harmonic line spectrum because the only frequencies present in the spectrum are integer multiples of the fundamental frequency With the spectrogram, it is easy to exhibit this harmonic line characteristic. More detail about the materials below can be found in Lectures 7 &8, and the Fourier Series text in Section 3-5 and Appendix C. (a) Write a simple MATLAB script that will generate a periodic full-wave rectified sine wave once the period is given. The peak amplitude should be equal to 1. Here is a MATLAB one-liner that can form the basis of this script tt-o: (1/fs) :tStop; xx=Amp*abs (sin(2*pjttt/T)) ; The values of fs, tStop, T, Amp will have to be determined. (b) Generate a full-wave rectified sine wave with T=1 sec, using a sampling rate of fs = 1000 Hz. The duration should be 5 secs, and Amp = 1 (c) Make a spectrogram with a long section duration. It is important to pick a section duration that is equal to an integer number of periods of the periodic full-wave rectified sine waveform created in the previous part. Define TSECT to get exactly 5 periods, and then determine the section length LSECT (an integer) to be used in plotspec (d) You should expect to see a "harmonic line spectrum" in the spectrogram. Since frequency is along the vertical axis, the harmonic lines will appear as horizontal lines in the spectrogram. Make a list of all the harmonic frequencies that you can see in the spectrogram. Note the Fourier series coefficient can be found as (see Section 3-5.2): a,-12k- 42-ejm. = (e) Determine the fundamental frequency for the harmonic lines. Note here the fundamental frequency There is no single correct answer for Lbut you should pick a value that makes a smooth plot and lets you easily see the A long section duration in the spectrogram yields what is called a narrowband spectrogram because it will provide excellent doubles the original frequency of the sine wave after the full-wave rectification operation changing nature of the instantaneous frequency resolution of the frequency components of a signal. (f) Measure the magnitudes of the first and third harmonic lines by using the fseriesdemo GUI first (see Slide 21 of Lecture 07 for an illustration. Another example in in Figure 2 in the Pre-Lab part on Page 6 of Lab 05 here) and then confirm your values with the Fourier Series coefficient formula: m(1-4k (42-1) 3.2 Spectrogram of Periodic Full-Wave Rectified Sinusoid A periodic signal is known to have a Fourier Series, which is usually described as a harmonic line spectrum because the only frequencies present in the spectrum are integer multiples of the fundamental frequency With the spectrogram, it is easy to exhibit this harmonic line characteristic. More detail about the materials below can be found in Lectures 7 &8, and the Fourier Series text in Section 3-5 and Appendix C. (a) Write a simple MATLAB script that will generate a periodic full-wave rectified sine wave once the period is given. The peak amplitude should be equal to 1. Here is a MATLAB one-liner that can form the basis of this script tt-o: (1/fs) :tStop; xx=Amp*abs (sin(2*pjttt/T)) ; The values of fs, tStop, T, Amp will have to be determined. (b) Generate a full-wave rectified sine wave with T=1 sec, using a sampling rate of fs = 1000 Hz. The duration should be 5 secs, and Amp = 1 (c) Make a spectrogram with a long section duration. It is important to pick a section duration that is equal to an integer number of periods of the periodic full-wave rectified sine waveform created in the previous part. Define TSECT to get exactly 5 periods, and then determine the section length LSECT (an integer) to be used in plotspec (d) You should expect to see a "harmonic line spectrum" in the spectrogram. Since frequency is along the vertical axis, the harmonic lines will appear as horizontal lines in the spectrogram. Make a list of all the harmonic frequencies that you can see in the spectrogram. Note the Fourier series coefficient can be found as (see Section 3-5.2): a,-12k- 42-ejm. = (e) Determine the fundamental frequency for the harmonic lines. Note here the fundamental frequency There is no single correct answer for Lbut you should pick a value that makes a smooth plot and lets you easily see the A long section duration in the spectrogram yields what is called a narrowband spectrogram because it will provide excellent doubles the original frequency of the sine wave after the full-wave rectification operation changing nature of the instantaneous frequency resolution of the frequency components of a signal. (f) Measure the magnitudes of the first and third harmonic lines by using the fseriesdemo GUI first (see Slide 21 of Lecture 07 for an illustration. Another example in in Figure 2 in the Pre-Lab part on Page 6 of Lab 05 here) and then confirm your values with the Fourier Series coefficient formula: m(1-4k (42-1)


