MATLAB:
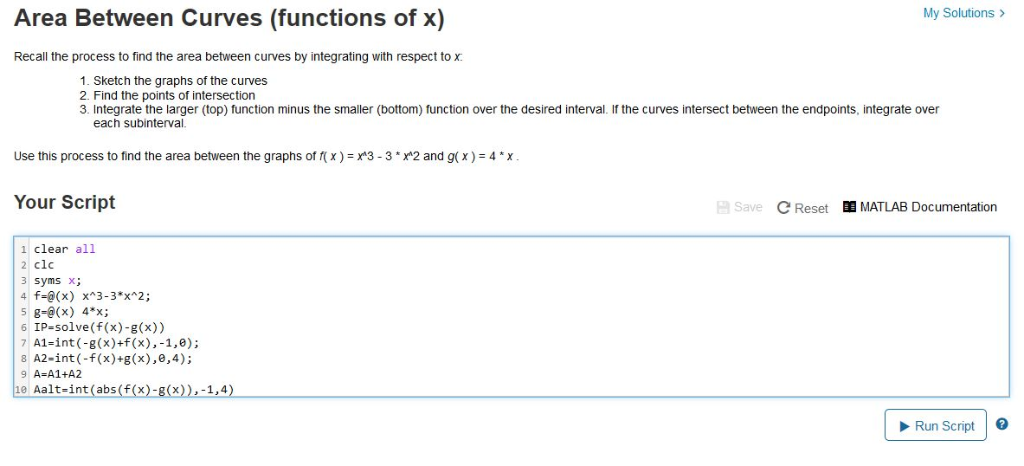
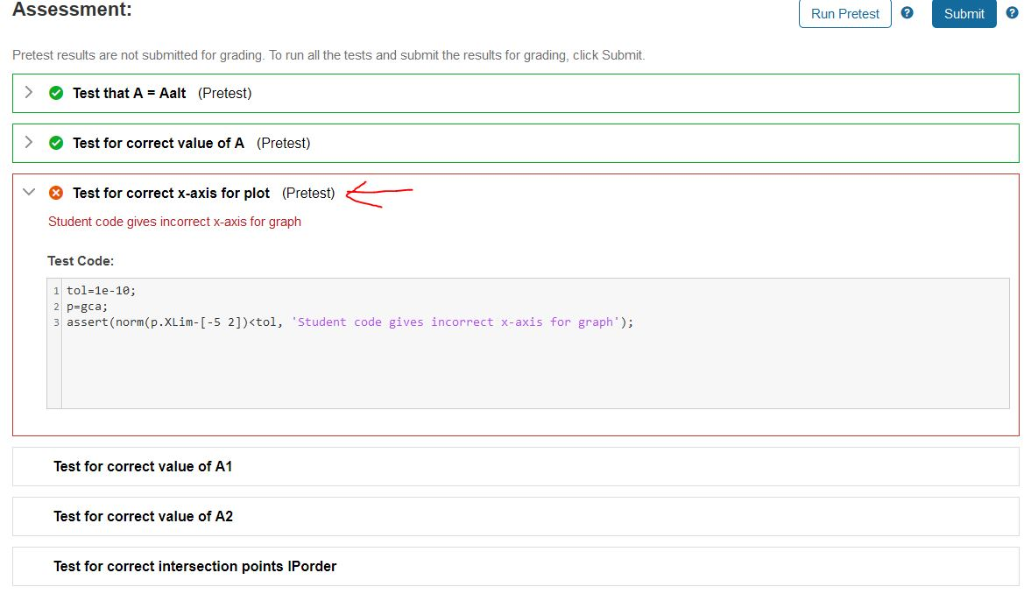
please help filling script box below. I got an error with last part(as shown with red arrow)
write the script or code that helps me fix this issue. Thanks in advance.


My Solutions > Area Between Curves (functions of x) Recall the process to find the area between curves by integrating with respect to x 1. Sketch the graphs of the curves 2. Find the points of intersection 3. Integrate the larger (top) function minus the smaller (bottom) function over the desired interval. If the curves intersect between the endpoints, integrate over each subinterval. Use this process to find the area between the graphs of r x ) #3-3 *x2 and g(X ) 4 "X Your Script E Save C Reset MATLAB Documentation 1 clear all 2 clc 3 syms x; 4 f-@(x) x*3-3*x*2; 5 g-@(x) 4*x; 6 IP-solve(f(x)-g(x)) 7 A1-int(-g(x)+f(x), -1,e); 8 A2-int (-f(x)+g (x),e,4) 9 A A1+A2 10 Aalt-int(abs (f(x)-g(x)),-1.4 Run Script Assessment: Run Pretest Submit Pretest results are not submitted for grading. To run all the tests and submit the results for grading, click Submit Test that A Aalt (Pretest) Test for correct value of A (Pretest) Test for correct x-axis for plot (Pretest) Student code gives incorrect x-axis for graph Test Code: 1 tol-1e-10; 2 p-gcaj 3.assert(norn(p.XLm-[-5 2]jctol, 'Student code gives incorrect x-axis for graph'); Test for correct value of A1 Test for correct value of A2 Test for correct intersection points IPorder My Solutions > Area Between Curves (functions of x) Recall the process to find the area between curves by integrating with respect to x 1. Sketch the graphs of the curves 2. Find the points of intersection 3. Integrate the larger (top) function minus the smaller (bottom) function over the desired interval. If the curves intersect between the endpoints, integrate over each subinterval. Use this process to find the area between the graphs of r x ) #3-3 *x2 and g(X ) 4 "X Your Script E Save C Reset MATLAB Documentation 1 clear all 2 clc 3 syms x; 4 f-@(x) x*3-3*x*2; 5 g-@(x) 4*x; 6 IP-solve(f(x)-g(x)) 7 A1-int(-g(x)+f(x), -1,e); 8 A2-int (-f(x)+g (x),e,4) 9 A A1+A2 10 Aalt-int(abs (f(x)-g(x)),-1.4 Run Script Assessment: Run Pretest Submit Pretest results are not submitted for grading. To run all the tests and submit the results for grading, click Submit Test that A Aalt (Pretest) Test for correct value of A (Pretest) Test for correct x-axis for plot (Pretest) Student code gives incorrect x-axis for graph Test Code: 1 tol-1e-10; 2 p-gcaj 3.assert(norn(p.XLm-[-5 2]jctol, 'Student code gives incorrect x-axis for graph'); Test for correct value of A1 Test for correct value of A2 Test for correct intersection points IPorder


