Answered step by step
Verified Expert Solution
Link Copied!

Question

1 Approved Answer

MATLAB Plot and Function 4. Provide your commands to make a plot animation of the following data in the order that it appears. Each data

MATLAB image text in transcribed
Plot and Function 4. Provide your commands to make a plot animation of the following data in the order that it appears. Each data point should be represented as a circle. The circles should remain while more data is added. Set the boundary of the graph window such that the right x boundary corresponds to the largest x-coordinate of any given coordinate pair, and the left x boundary corresponds to the smallest x-coordinate of any given coordinate pair. Do the same for the y boundaries. You may use predefined functions "min" and "max." (3) X472 8 -3 -4 101-5 Y82-3-91 0 2 17

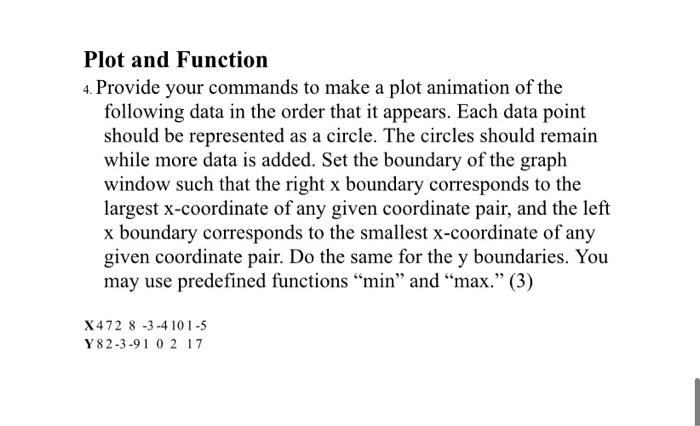
Step by Step Solution

There are 3 Steps involved in it

Step: 1

blur-text-image

Get Instant Access to Expert-Tailored Solutions

See step-by-step solutions with expert insights and AI powered tools for academic success

Step: 2

blur-text-image

Step: 3

blur-text-image

Ace Your Homework with AI

Get the answers you need in no time with our AI-driven, step-by-step assistance

Get Started

Recommended Textbook for

Making Databases Work The Pragmatic Wisdom Of Michael Stonebraker

Authors: Michael L. Brodie

1st Edition

1947487167, 978-1947487161

More Books

Students also viewed these Databases questions

Question

Explain the function and purpose of the Job Level Table.

Answered: 1 week ago