

Answered step by step
Verified Expert Solution
Question
1 Approved Answer
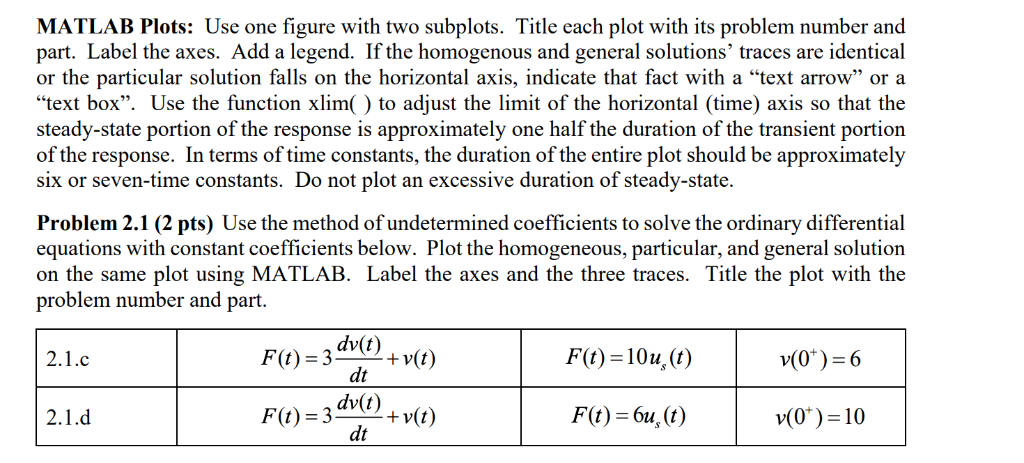
MATLAB Plots: Use one figure with two subplots. Title each plot with its problem number and part. Label the axes. Add a legend. If the
Step by Step Solution
There are 3 Steps involved in it
Step: 1

Get Instant Access to Expert-Tailored Solutions
See step-by-step solutions with expert insights and AI powered tools for academic success
Step: 2

Step: 3
Ace Your Homework with AI
Get the answers you need in no time with our AI-driven, step-by-step assistance
Get Started
Database And Expert Systems Applications 33rd International Conference Dexa 2022 Vienna Austria August 22 24 2022 Proceedings Part 1 Lncs 13426
Authors: Christine Strauss ,Alfredo Cuzzocrea ,Gabriele Kotsis ,A Min Tjoa ,Ismail Khalil
1st Edition
3031124227, 978-3031124228