Answered step by step
Verified Expert Solution
Question
1 Approved Answer
MATLAB PLS The evolution of the Sierpinski triangle Introduction The Sierpinski triangle can be implemented in MATLAB by plotting points iteratively according to one of
MATLAB PLS
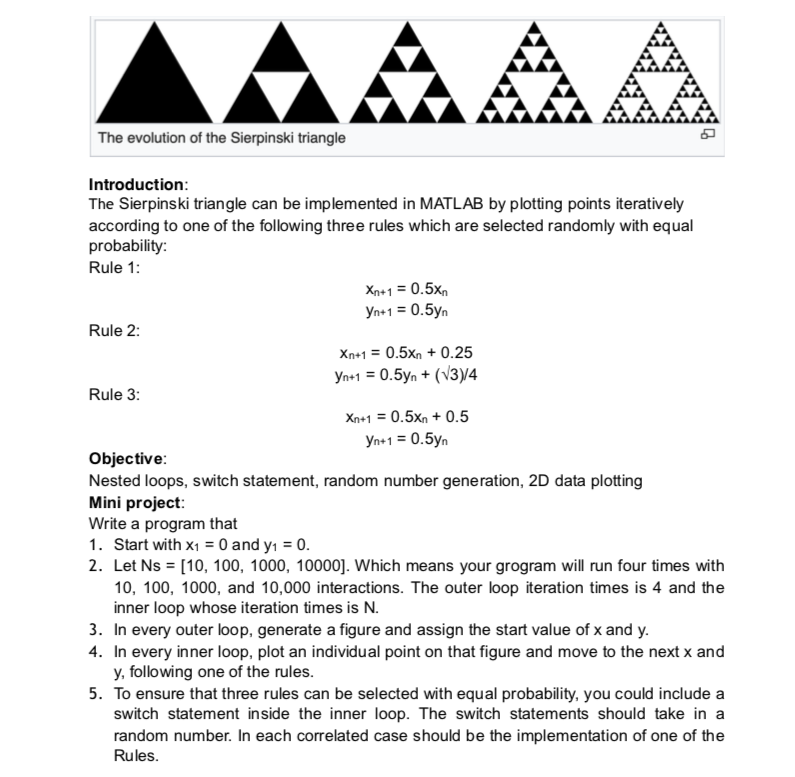
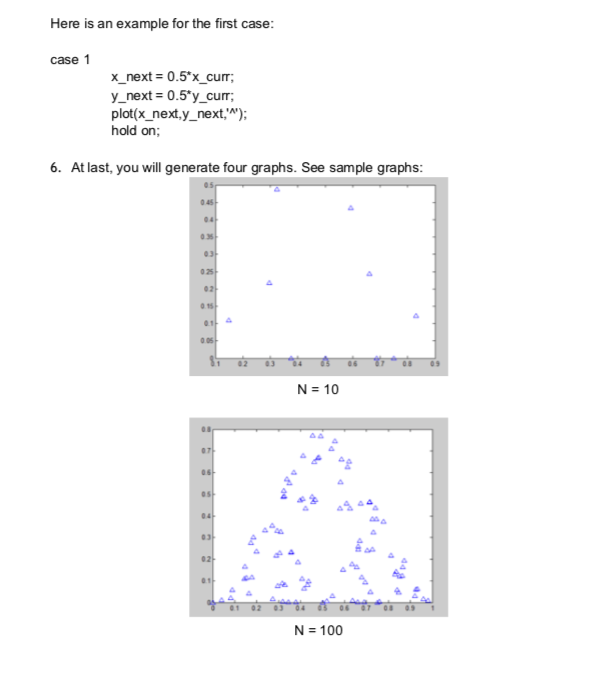
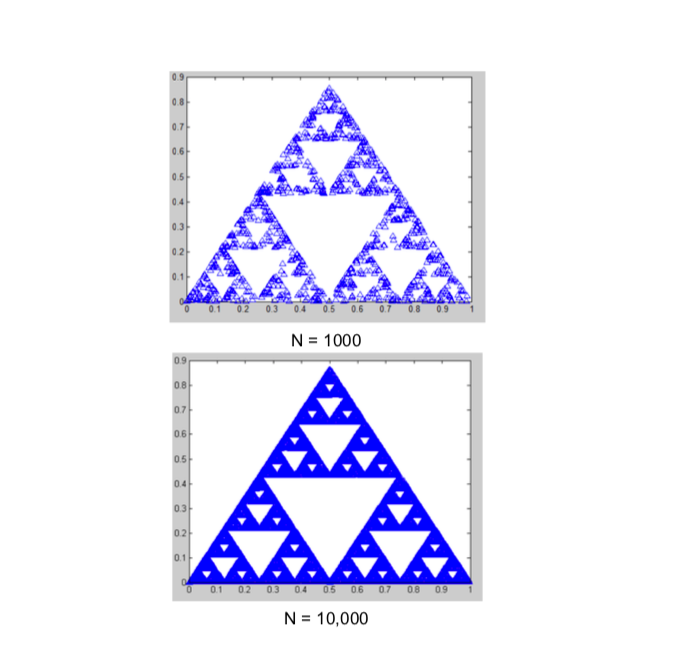
The evolution of the Sierpinski triangle Introduction The Sierpinski triangle can be implemented in MATLAB by plotting points iteratively according to one of the following three rules which are selected randomly with equal probability: Rule 1 Rule 2: Xn+0.5xn0.25 n0.5yn(3)4 Kn+1 = 0.5Kn + 0.5 Rule 3 Objective Nested loops, switch statement, random number generation, 2D data plotting Mini project Write a program that 1. Start with x10 and y0 2. Let Ns [10, 100, 1000, 10000]. Which means your grogram will run four times with 10, 100, 1000, and 10,000 interactions. The outer loop iteration times is 4 and the inner loop whose iteration times is N. 3. In every outer loop, generate a figure and assign the start value of x and y 4. In every inner loop, plot an individual point on that figure and move to the next x and y, following one of the rules 5. To ensure that three rules can be selected with equal probability, you could include a switch statement inside the inner loop. The switch statements should take in a random number. In each correlated case should be the implementation of one of the Rules Here is an example for the first case: case 1 x_next- 0.5x_curr y-next = 0.5"y-curr; plot(x_next,y_next,) hold on; 6. At last, you will generate four graphs. See sample graphs 0 45 0 38 03 0 25 02 0 05 N = 10 07 0 6 05 04 03 02 0 1 N 100 0.3 0 0.1 02 03 04 05 06 07 0809 1 N 1000 0.9 0.6 0.5 0.3 02 0.1 02 03 04 05 06 07 08 09 N 10,000Step by Step Solution
There are 3 Steps involved in it
Step: 1
Get Instant Access to Expert-Tailored Solutions
See step-by-step solutions with expert insights and AI powered tools for academic success
Step: 2
Step: 3
Ace Your Homework with AI
Get the answers you need in no time with our AI-driven, step-by-step assistance
Get Started