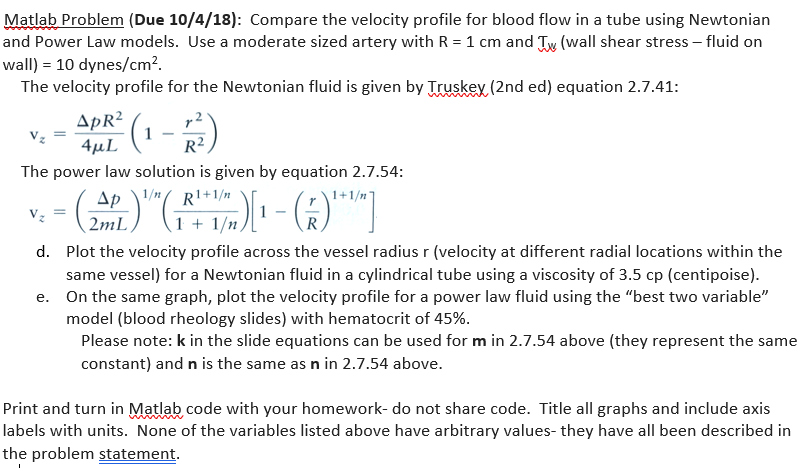
Matlab Problem (Due 10/4/18): Compare the velocity profile for blood flow in a tube using Newtonian and Power Law models. Use a moderate sized artery with R-1 cm and T (wall shear stress-fluid on wall) 10 dynes/cm'. The velocity profile for the Newtonian fluid is given by Truskex (2nd ed) equation 2.7.41: 4L The power law solution is given by equation 2.7.54: 2mL1 1 Plot the velocity profile across the vessel radius r (velocity at different radial locations within the same vessel) for a Newtonian fluid in a cylindrical tube using a viscosity of 3.5 cp (centipoise). On the same graph, plot the velocity profile for a power law fluid using the "best two variable" model (blood rheology slides) with hematocrit of 45%. d. e. Please note: k in the slide equations can be used for m in 2.7.54 above (they represent the same constant) and n is the same as n in 2.7.54 above. Print and turn in Matlab code with your homework- do not share code. Title all graphs and include axis labels with units. None of the variables listed above have arbitrary values- they have all been described in the problem statement Matlab Problem (Due 10/4/18): Compare the velocity profile for blood flow in a tube using Newtonian and Power Law models. Use a moderate sized artery with R-1 cm and T (wall shear stress-fluid on wall) 10 dynes/cm'. The velocity profile for the Newtonian fluid is given by Truskex (2nd ed) equation 2.7.41: 4L The power law solution is given by equation 2.7.54: 2mL1 1 Plot the velocity profile across the vessel radius r (velocity at different radial locations within the same vessel) for a Newtonian fluid in a cylindrical tube using a viscosity of 3.5 cp (centipoise). On the same graph, plot the velocity profile for a power law fluid using the "best two variable" model (blood rheology slides) with hematocrit of 45%. d. e. Please note: k in the slide equations can be used for m in 2.7.54 above (they represent the same constant) and n is the same as n in 2.7.54 above. Print and turn in Matlab code with your homework- do not share code. Title all graphs and include axis labels with units. None of the variables listed above have arbitrary values- they have all been described in the problem statement


