@matlab problem
@matlab problem
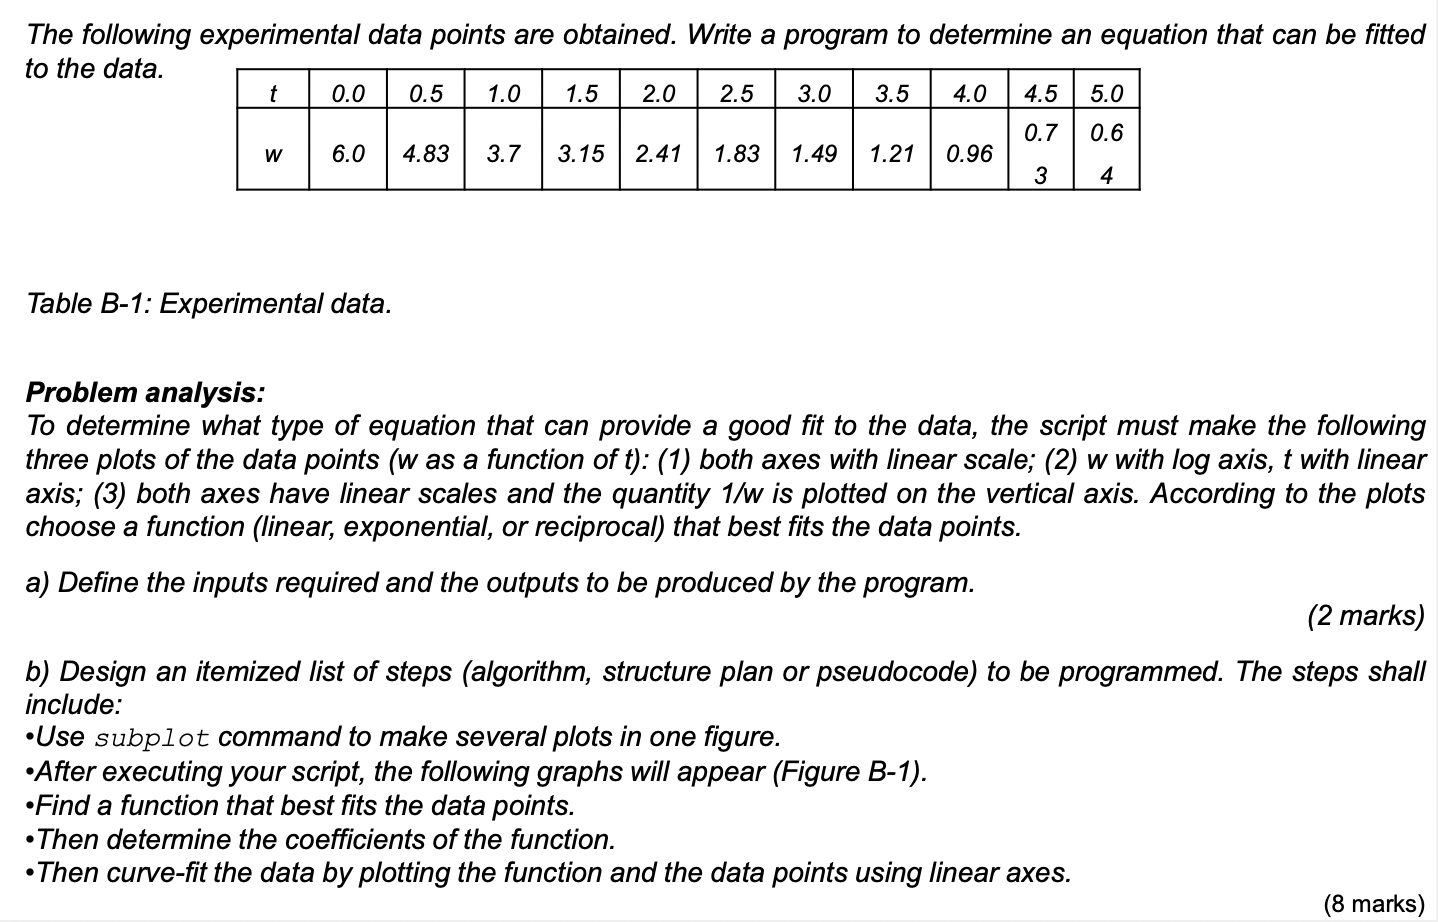

The following experimental data points are obtained. Write a program to determine an equation that can be fitted to the data. 0.0 0.5 1.0 1.5 2.0 2.5 3.0 3.5 4.0 4.5 5.0 t 0.7 0.6 w 6.0 4.83 3.7 3.15 2.41 1.83 1.49 1.21 0.96 3 4 Table B-1: Experimental data. Problem analysis: To determine what type of equation that can provide a good fit to the data, the script must make the following three plots of the data points (w as a function of t): (1) both axes with linear scale; (2) w with log axis, t with linear axis; (3) both axes have linear scales and the quantity 1/w is plotted on the vertical axis. According to the plots choose a function (linear, exponential, or reciprocal) that best fits the data points. a) Define the inputs required and the outputs to be produced by the program. (2 marks) b) Design an itemized list of steps (algorithm, structure plan or pseudocode) to be programmed. The steps shall include: Use subplot command to make several plots in one figure. After executing your script, the following graphs will appear (Figure B-1). Find a function that best fits the data points. Then determine the coefficients of the function. Then curve-fit the data by plotting the function and the data points using linear axes. (8 marks) . . linear plot exponential plot 0 5 0 0 O O O 0 2 O O 10 o O 0 0.5 1 1.5 2 3 3.5 4 45 5 0 0.5 1 15 2 35 4 4.5 5 2.5 + 25 t reciprocal plot 1.5 O o 0 o 0.5| O 0 04 0.5 1 1.5 2 3 3.5 4 4.5 5 2.5 + Figure B-1: Three plots of the data points (w as a function of t): (1) both axes with linear scale; (2) w with log axis, t with linear axis; (3) both axes have linear scales and the quantity 1/w is plotted on the vertical axis. c) Convert the algorithm into a computer language. (10 marks) d) Sketch the flow chart of your program. (5 marks) (Total:25 marks) The following experimental data points are obtained. Write a program to determine an equation that can be fitted to the data. 0.0 0.5 1.0 1.5 2.0 2.5 3.0 3.5 4.0 4.5 5.0 t 0.7 0.6 w 6.0 4.83 3.7 3.15 2.41 1.83 1.49 1.21 0.96 3 4 Table B-1: Experimental data. Problem analysis: To determine what type of equation that can provide a good fit to the data, the script must make the following three plots of the data points (w as a function of t): (1) both axes with linear scale; (2) w with log axis, t with linear axis; (3) both axes have linear scales and the quantity 1/w is plotted on the vertical axis. According to the plots choose a function (linear, exponential, or reciprocal) that best fits the data points. a) Define the inputs required and the outputs to be produced by the program. (2 marks) b) Design an itemized list of steps (algorithm, structure plan or pseudocode) to be programmed. The steps shall include: Use subplot command to make several plots in one figure. After executing your script, the following graphs will appear (Figure B-1). Find a function that best fits the data points. Then determine the coefficients of the function. Then curve-fit the data by plotting the function and the data points using linear axes. (8 marks) . . linear plot exponential plot 0 5 0 0 O O O 0 2 O O 10 o O 0 0.5 1 1.5 2 3 3.5 4 45 5 0 0.5 1 15 2 35 4 4.5 5 2.5 + 25 t reciprocal plot 1.5 O o 0 o 0.5| O 0 04 0.5 1 1.5 2 3 3.5 4 4.5 5 2.5 + Figure B-1: Three plots of the data points (w as a function of t): (1) both axes with linear scale; (2) w with log axis, t with linear axis; (3) both axes have linear scales and the quantity 1/w is plotted on the vertical axis. c) Convert the algorithm into a computer language. (10 marks) d) Sketch the flow chart of your program. (5 marks) (Total:25 marks)