Matlab program
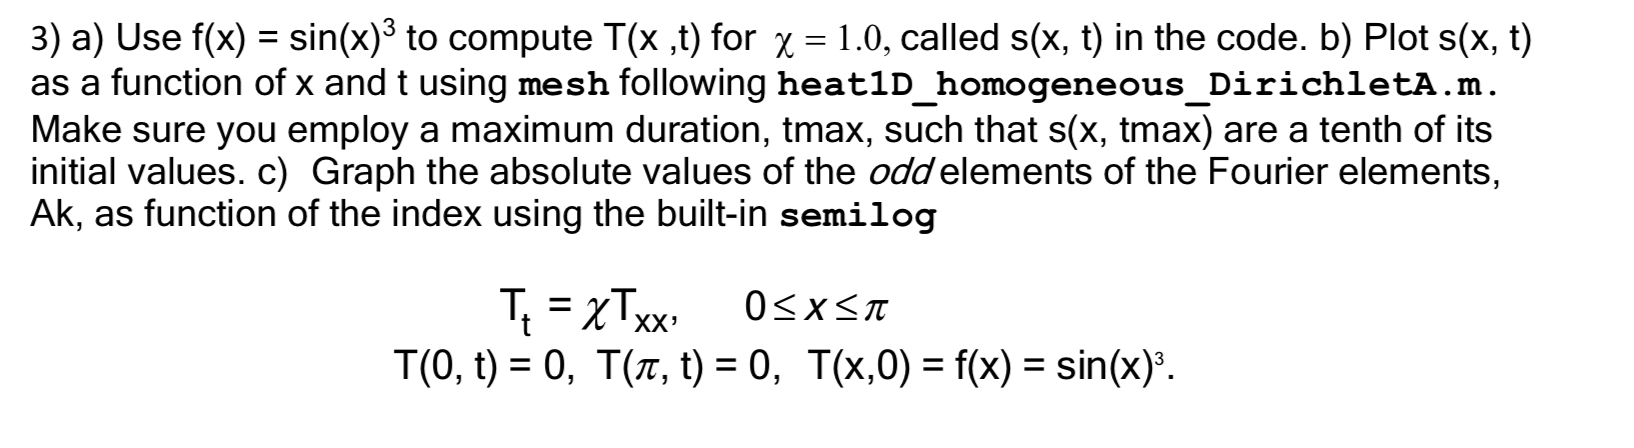
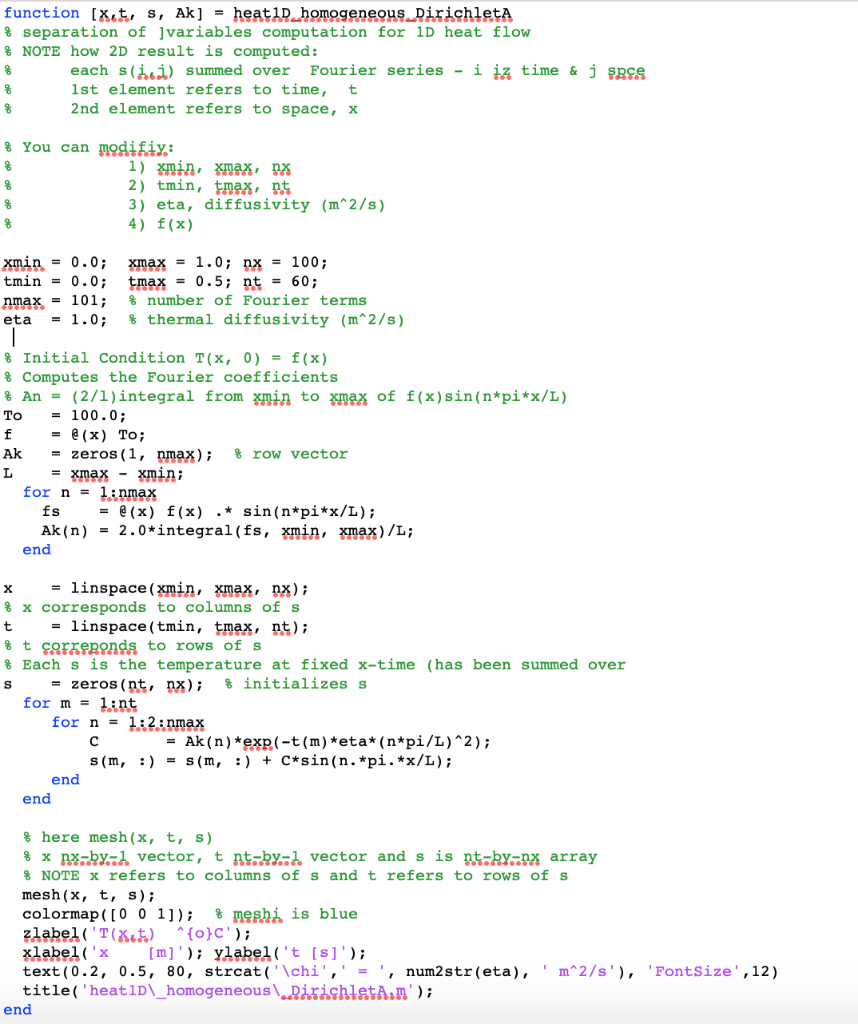
3) a) Use f(x) = sin(x)3 to compute T(x ,t) for x = 1.0, called s(x, t) in the code. b) Plot s(x, t) as a function of x and t using mesh following heatiD_homogeneous_DirichletA.m. Make sure you employ a maximum duration, tmax, such that s(x, tmax) are a tenth of its initial values. c) Graph the absolute values of the odd elements of the Fourier elements, Ak, as function of the index using the built-in semilog T: = xTxx, OSX SA T(0, t) = 0, T(1, t) = 0, T(x,0) = f(x) = sin(x). function (Xet, s, Ak] = heatin homogeneous DirichletA % separation of ] variables computation for 10 heat flow % NOTE how 2D result is computed: each slici) summed over Fourier series - i iz time & j spce 1st element refers to time, t 2nd element refers to space, X & You can modifiy: 1) xmin, xmax, nx 2) tmin, tmax, nt 3) eta, diffusivity (m2/s) 4) f(x) xmin = 0.0; tmin = 0.0; nmax = 101; eta = 1.0; xmax = 1.0; nx = 100; tmax = 0.5; nt = 60; number of Fourier terms & thermal diffusivity (m^2/s) & Initial Condition T(x, 0) = f(x) % Computes the Fourier coefficients % An = (2/1)integral from xmin to xmax of f(x) sin(n*pi*x/L) To = 100.0; f = @(x) To; Ak - zeros (1, nmax); $row vector L = xmax - xmin; for n = 1.: nmax fs = @(x) f(x) .* sin(n*pi*x/L); Ak (n) = 2.0*integral(fs, xmin, xmax)/L; end x = linspace(xmin, xmax, nx); % x corresponds to columns of s t = linspace(tmin, tmax, nt); $t correponds to rows of s % Each s is the temperature at fixed x-time (has been summed over S - zeros (nt, nx); $ initializes s for m = 1.: nt for n = 1:2.: nmax C = Ak (n) *exp(-t(m)*eta* (n*pi/L)^2); s(m, :) = s(m, :) + C*sin(n. *pi.*x/L); end end % here mesh(x, t, s) % x nx-by-l vector, tnt-by-d vector and sis nt-by-nx array % NOTE X refers to columns of s and t refers to rows of s mesh(x, t, s); colormap([ 0 0 1]); 8 meshi is blue zlabel('T(X ) ^{}C'); xlabel('x [m]'); ylabel('t [s]); text(0.2, 0.5, 80, strcat('\chi',' = ', num2 str(eta), 'm^2/s'), 'FontSize', 12) title('heat1D\_homogeneous RisishistAsm'); end 3) a) Use f(x) = sin(x)3 to compute T(x ,t) for x = 1.0, called s(x, t) in the code. b) Plot s(x, t) as a function of x and t using mesh following heatiD_homogeneous_DirichletA.m. Make sure you employ a maximum duration, tmax, such that s(x, tmax) are a tenth of its initial values. c) Graph the absolute values of the odd elements of the Fourier elements, Ak, as function of the index using the built-in semilog T: = xTxx, OSX SA T(0, t) = 0, T(1, t) = 0, T(x,0) = f(x) = sin(x). function (Xet, s, Ak] = heatin homogeneous DirichletA % separation of ] variables computation for 10 heat flow % NOTE how 2D result is computed: each slici) summed over Fourier series - i iz time & j spce 1st element refers to time, t 2nd element refers to space, X & You can modifiy: 1) xmin, xmax, nx 2) tmin, tmax, nt 3) eta, diffusivity (m2/s) 4) f(x) xmin = 0.0; tmin = 0.0; nmax = 101; eta = 1.0; xmax = 1.0; nx = 100; tmax = 0.5; nt = 60; number of Fourier terms & thermal diffusivity (m^2/s) & Initial Condition T(x, 0) = f(x) % Computes the Fourier coefficients % An = (2/1)integral from xmin to xmax of f(x) sin(n*pi*x/L) To = 100.0; f = @(x) To; Ak - zeros (1, nmax); $row vector L = xmax - xmin; for n = 1.: nmax fs = @(x) f(x) .* sin(n*pi*x/L); Ak (n) = 2.0*integral(fs, xmin, xmax)/L; end x = linspace(xmin, xmax, nx); % x corresponds to columns of s t = linspace(tmin, tmax, nt); $t correponds to rows of s % Each s is the temperature at fixed x-time (has been summed over S - zeros (nt, nx); $ initializes s for m = 1.: nt for n = 1:2.: nmax C = Ak (n) *exp(-t(m)*eta* (n*pi/L)^2); s(m, :) = s(m, :) + C*sin(n. *pi.*x/L); end end % here mesh(x, t, s) % x nx-by-l vector, tnt-by-d vector and sis nt-by-nx array % NOTE X refers to columns of s and t refers to rows of s mesh(x, t, s); colormap([ 0 0 1]); 8 meshi is blue zlabel('T(X ) ^{}C'); xlabel('x [m]'); ylabel('t [s]); text(0.2, 0.5, 80, strcat('\chi',' = ', num2 str(eta), 'm^2/s'), 'FontSize', 12) title('heat1D\_homogeneous RisishistAsm'); end