Answered step by step
Verified Expert Solution
Question
1 Approved Answer
MAtlab Program Parts 4,5 and 6 are all very similar but you are asked to create identical functions using three different methods, and create plots

MAtlab Program
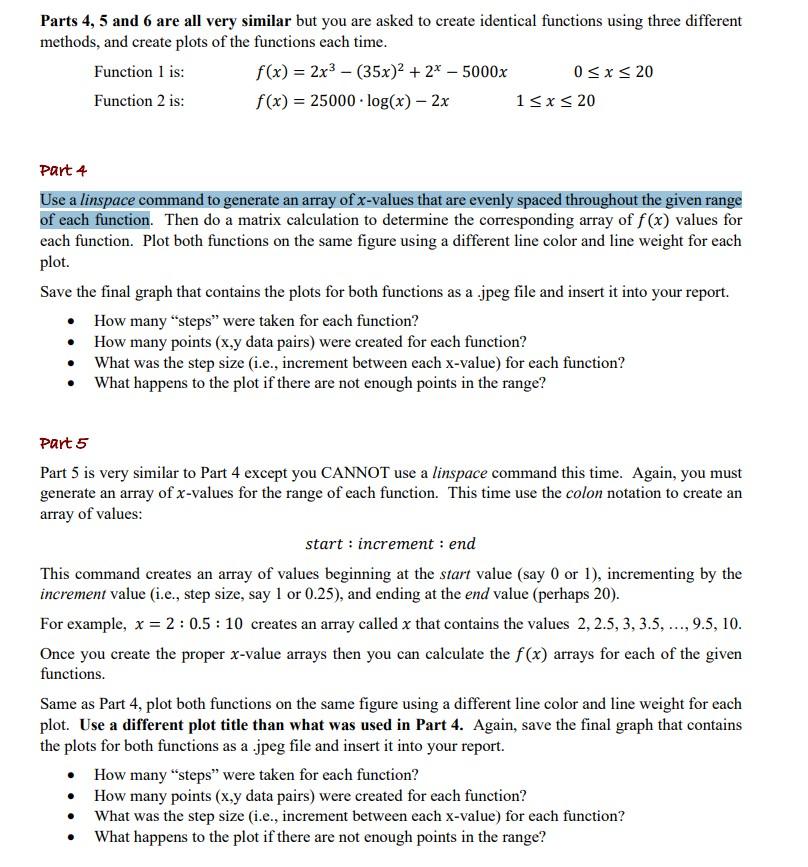
Parts 4,5 and 6 are all very similar but you are asked to create identical functions using three different methods, and create plots of the functions each time. Function 1 is: Function1is:Function2is:f(x)=2x3(35x)2+2x5000xf(x)=25000log(x)2x0x201x20 Part 4 Use a linspace command to generate an array of x-values that are evenly spaced throughout the given range of each function. Then do a matrix calculation to determine the corresponding array of f(x) values for each function. Plot both functions on the same figure using a different line color and line weight for each plot. Save the final graph that contains the plots for both functions as a .jpeg file and insert it into your report. - How many "steps" were taken for each function? - How many points (x,y data pairs) were created for each function? - What was the step size (i.e., increment between each x-value) for each function? - What happens to the plot if there are not enough points in the range? Part 5 Part 5 is very similar to Part 4 except you CANNOT use a linspace command this time. Again, you must generate an array of x-values for the range of each function. This time use the colon notation to create an array of values: start : increment : end This command creates an array of values beginning at the start value (say 0 or 1), incrementing by the increment value (i.e., step size, say 1 or 0.25 ), and ending at the end value (perhaps 20). For example, x=2:0.5:10 creates an array called x that contains the values 2,2.5,3,3.5,,9.5,10. Once you create the proper x-value arrays then you can calculate the f(x) arrays for each of the given functions. Same as Part 4, plot both functions on the same figure using a different line color and line weight for each plot. Use a different plot title than what was used in Part 4. Again, save the final graph that contains the plots for both functions as a .jpeg file and insert it into your report. - How many "steps" were taken for each function? - How many points (x,y data pairs) were created for each function? - What was the step size (i.e., increment between each x-value) for each function? - What happens to the plot if there are not enough points in the rangeStep by Step Solution
There are 3 Steps involved in it
Step: 1

Get Instant Access to Expert-Tailored Solutions
See step-by-step solutions with expert insights and AI powered tools for academic success
Step: 2

Step: 3

Ace Your Homework with AI
Get the answers you need in no time with our AI-driven, step-by-step assistance
Get Started


