Matlab Programming

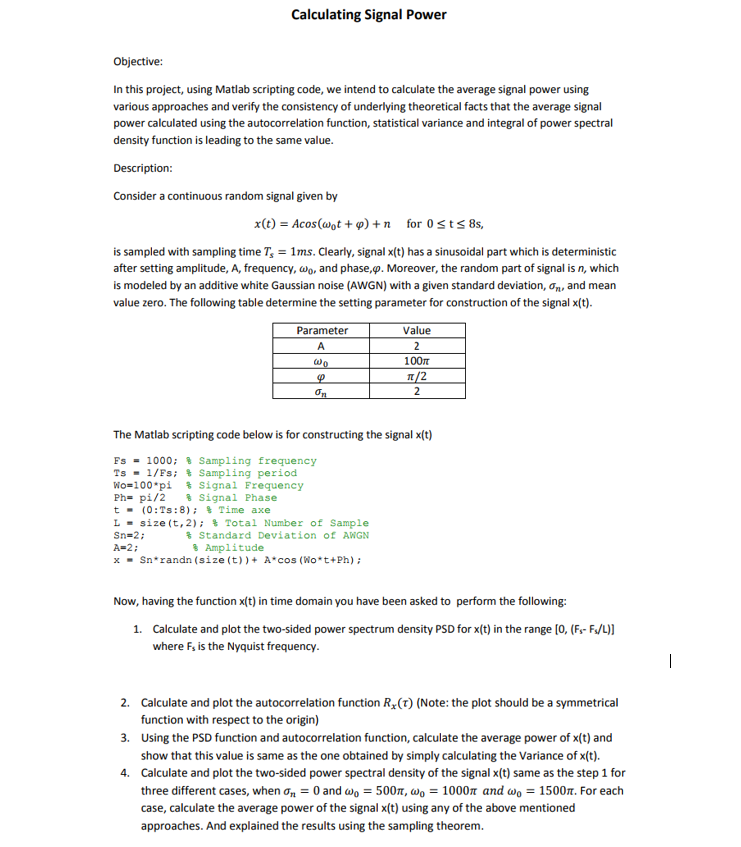
Objective: In this project, using Matlab scripting code, we intend to calculate the average signal power using various approaches and verify the consistency of underlying theoretical facts that the average signal power calculated using the autocorrelation function, statistical variance and integral of power spectral density function is leading to the same value. Description: Consider a continuous random signal given by x(t) = Acos(omega_0 t + phi) + n for 0 lessthanorequalto t lessthanorequalto 8s, is sampled with sampling time T_s = 1ms. Clearly, signal x(t) has a sinusoidal part which is deterministic after setting amplitude, A, frequency, omega_0, and phase, phi. Moreover, the random part of signal is n, which is modeled by an additive white Gaussian noise (AWGN) with a given standard deviation, sigma_n, and mean value zero. The following table determine the setting parameter for construction of the signal x(t). The Matlab scripting code below is for constructing the signal x(t) Fs = 1000: % Sampling frequency Ts = 1/Fs: % Sampling period Wo = 100 * pi % signal Frequency Ph = pi/2 % Signal Phase t = (0: Ts: 8): % Time axe L = size(t, 2): % Total Number of Sample Sn = 2: % Standard Deviation of AWGN A = 2: % Amplitude x = Sn * randn (size (t)) + A * cos (Wo * t + ph): Now, having the function x(t) in time domain you have been asked to perform the following: Calculate and plot the two-sided power spectrum density PSD for x(t) in the range [0, (F_s - F_s/L)] where F_s is the Nyquist frequency. Calculate and plot the autocorrelation function R_x (tau) Using the PSD function and autocorrelation function, calculate the average power of x(t) and show that this value is same as the one obtained by simply calculating the Variance of x(t). Calculate and plot the two-sided power spectral density of the signal x(t) same as the step 1 for three different cases, when sigma_n = 0 and omega_0 = 500 pi, omega_0 = 1000 pi and omega_0 = 1500 pi. For each case, calculate the average power of the signal x(t) using any of the above mentioned approaches. And explained the results using the sampling theorem


