Answered step by step
Verified Expert Solution
Link Copied!

Question

1 Approved Answer

Matlab project 1 1 Plot the directional field of the differential equation in the rectangular region [0, 5] [-2, 2] on the (t,y)-plane. 2 Using
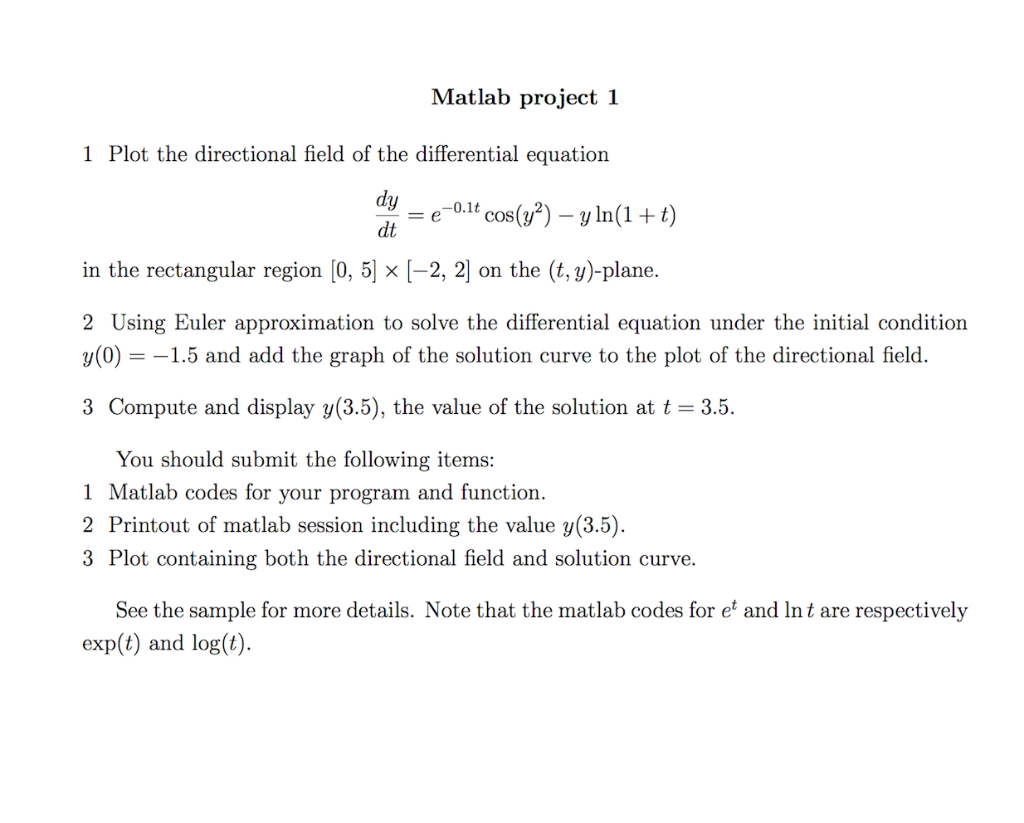
image text in transcribed

Matlab project 1 1 Plot the directional field of the differential equation in the rectangular region [0, 5] [-2, 2] on the (t,y)-plane. 2 Using Euler approximation to solve the differential equation under the initial condition (0)1.5 and add the graph of the solution curve to the plot of the directional field. 3 Compute and display y(3.5), the value of the solution at t 3.5 You should submit the following items 1 Matlab codes for your program and function 2 Printout of matlab session including the value y(3.5). 3 Plot containing both the directional field and solution curve. See the sample for more details. Note that the matlab codes for et and Int are respectively exp(t) and log(t)

Step by Step Solution

There are 3 Steps involved in it

Step: 1

blur-text-image

Get Instant Access to Expert-Tailored Solutions

See step-by-step solutions with expert insights and AI powered tools for academic success

Step: 2

blur-text-image_2

Step: 3

blur-text-image_3

Ace Your Homework with AI

Get the answers you need in no time with our AI-driven, step-by-step assistance

Get Started

Recommended Textbook for

From Herds To Insights Harnessing Data Analytics For Sustainable Livestock Farming

Authors: Prof Suresh Neethirajan

1st Edition

B0CFD6K6KK, 979-8857075487

More Books

Students also viewed these Databases questions