

Answered step by step
Verified Expert Solution
Question
1 Approved Answer
Matlab & q7 please matlab& q7 3. Plot F vs. yi in MATLAB for all three Tables. 4. Using MATLAB's Basic Fitting tool, find the
Matlab & q7 please
matlab& q7 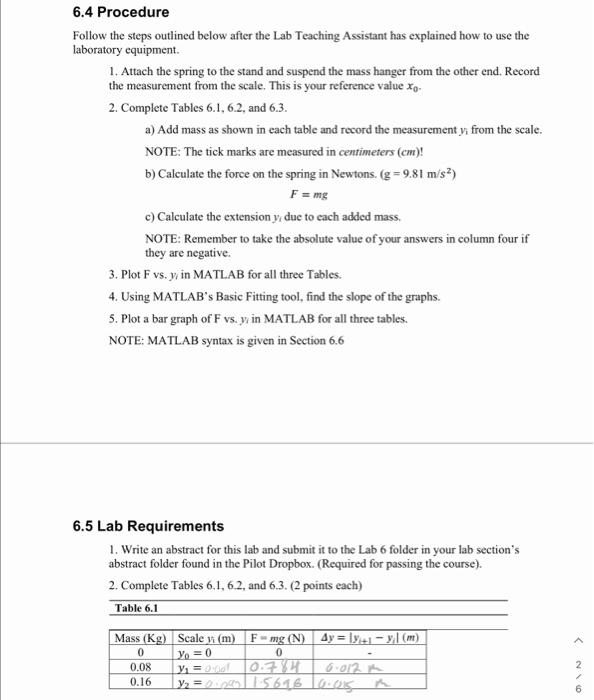
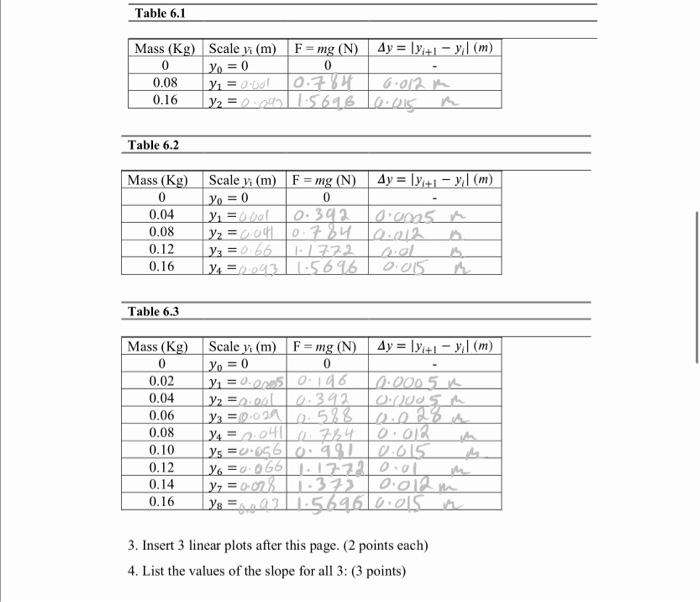
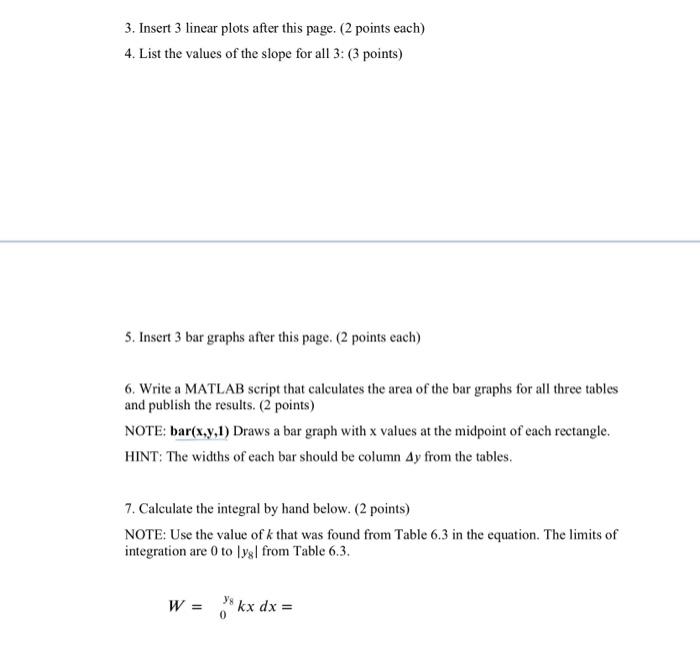
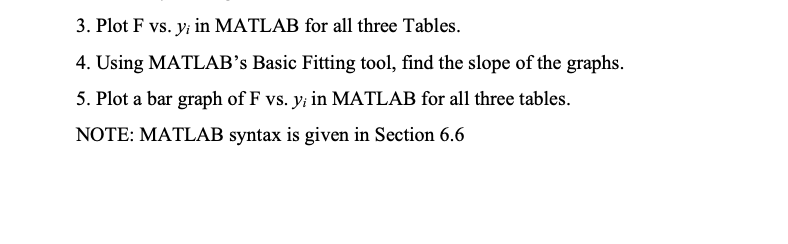
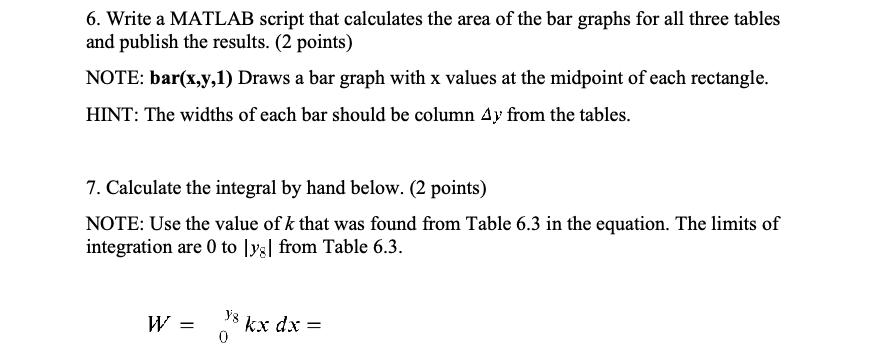
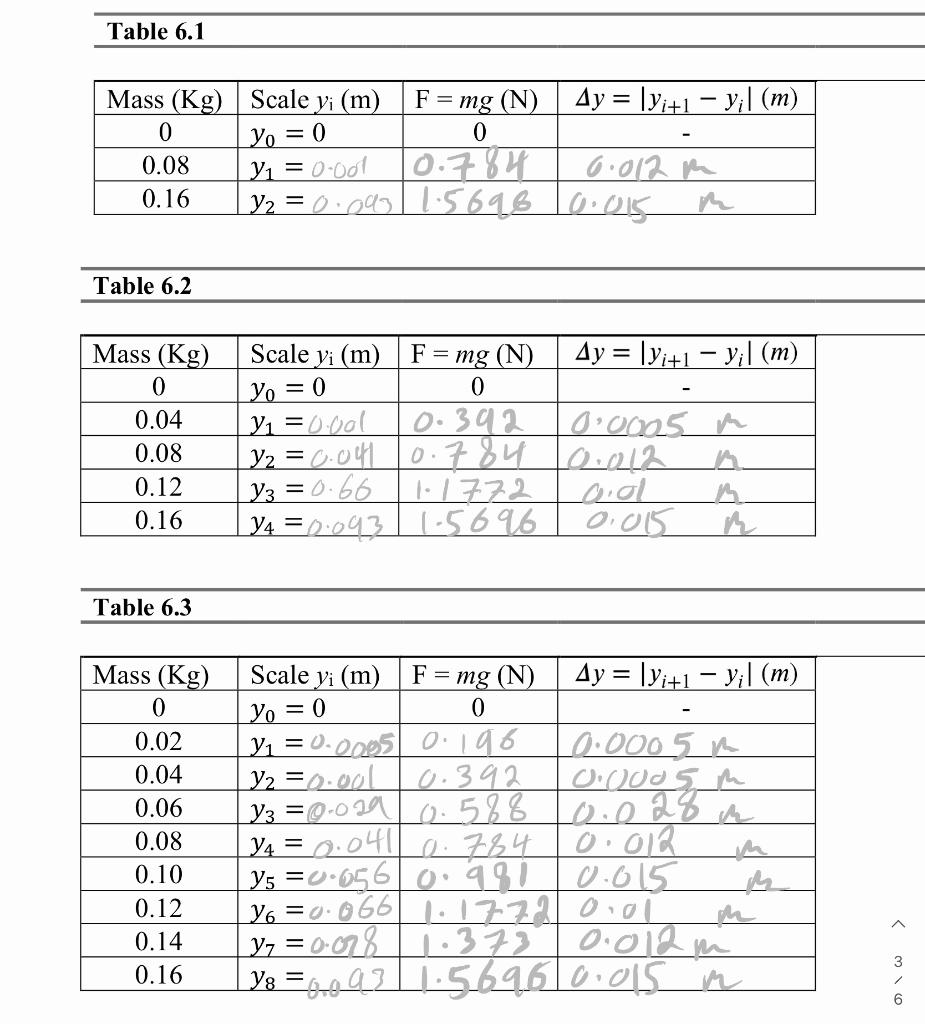
3. Plot F vs. yi in MATLAB for all three Tables. 4. Using MATLAB's Basic Fitting tool, find the slope of the graphs. 5. Plot a bar graph of F vs. yi in MATLAB for all three tables. NOTE: MATLAB syntax is given in Section 6.6 6. Write a MATLAB script that calculates the area of the bar graphs for all three tables and publish the results. (2 points) NOTE: bar(x,y,1) Draws a bar graph with x values at the midpoint of each rectangle. HINT: The widths of each bar should be column y from the tables. 7. Calculate the integral by hand below. ( 2 points) NOTE: Use the value of k that was found from Table 6.3 in the equation. The limits of integration are 0 to y8 from Table 6.3. W=0y8kxdx= . Follow the steps outlined below after the Lab Teaching Assistant has explained how to use the laboratory equipment. 1. Attach the spring to the stand and suspend the mass hanger from the other end. Record the measurement from the scale. This is your reference value x0 - 2. Complete Tables 6.1,6.2, and 6.3 . a) Add mass as shown in each table and record the measurement y1 from the scale. NOTE: The tick marks are measured in centimeters (cm) ! b) Calculate the force on the spring in Newtons. (g=9.81m/s2) F=mg c) Calculate the extension yi due to each added mass. NOTE: Remember to take the absolute value of your answers in column four if they are negative. 3. Plot F vs. yi in MATLAB for all three Tables. 4. Using MATLAB's Basic Fitting tool, find the slope of the graphs. 5. Plot a bar graph of F vs. y in MATLAB for all three tables. NOTE: MATLAB syntax is given in Section 6.6 6.5 Lab Requirements 1. Write an abstract for this lab and submit it to the Lab 6 folder in your lab section's abstract folder found in the Pilot Dropbox. (Required for passing the course). 2. Complete Tables 6.1,6.2, and 6.3 . (2 points each) Table 6.2 Table 6.3 3. Insert 3 linear plots after this page. (2 points each) 4. List the values of the slope for all 3 : ( 3 points) 3. Insert 3 linear plots after this page. ( 2 points each) 4. List the values of the slope for all 3: ( 3 points) 5. Insert 3 bar graphs after this page. (2 points each) 6. Write a MATLAB script that calculates the area of the bar graphs for all three tables and publish the results. ( 2 points) NOTE: bar (x,y,1) Draws a bar graph with x values at the midpoint of each rectangle. HINT: The widths of each bar should be column y from the tables. 7. Calculate the integral by hand below. ( 2 points) NOTE: Use the value of k that was found from Table 6.3 in the equation. The limits of integration are 0 to y8 from Table 6.3 . W=0y8kxdx= Step by Step Solution
There are 3 Steps involved in it
Step: 1

Get Instant Access to Expert-Tailored Solutions
See step-by-step solutions with expert insights and AI powered tools for academic success
Step: 2

Step: 3
Ace Your Homework with AI
Get the answers you need in no time with our AI-driven, step-by-step assistance
Get Started
Introduction To Chemical Engineering Analysis Using Mathematica
Authors: Henry C. Foley
1st Edition
0122619129, 978-0122619120