

Answered step by step
Verified Expert Solution
Question
1 Approved Answer
Matlab question. 2.4 (20 points) Plot 6 figures in a window as 2 rows by 3 columns using subplot. Create x to be from-2 to
Matlab question.
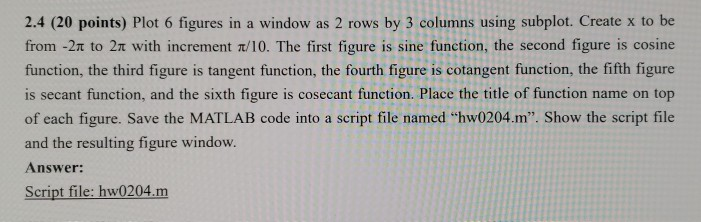
2.4 (20 points) Plot 6 figures in a window as 2 rows by 3 columns using subplot. Create x to be from-2 to 2 with increment /10. The first figure is sine function, the second figure is cosine finction,the third figure is tangent finction, the fourth figure is cotangent function, the fifth figure is secant function, and the sixth figure is cosecant function. Place the title of function name on top of each figure. Save the MATLAB code into a script file named "hw0204.m". Show the script file and the resulting figure window. Answer: Script file: hw0204.mStep by Step Solution
There are 3 Steps involved in it
Step: 1

Get Instant Access to Expert-Tailored Solutions
See step-by-step solutions with expert insights and AI powered tools for academic success
Step: 2

Step: 3
Ace Your Homework with AI
Get the answers you need in no time with our AI-driven, step-by-step assistance
Get Started
Advances In Databases And Information Systems 25th European Conference Adbis 2021 Tartu Estonia August 24 26 2021 Proceedings Lncs 12843
Authors: Ladjel Bellatreche ,Marlon Dumas ,Panagiotis Karras ,Raimundas Matulevicius
1st Edition
3030824713, 978-3030824716