Answered step by step
Verified Expert Solution
Link Copied!
Question
1 Approved Answer

matlab question 5. (15%) in your function, 1) create a vector x for 0 to 2nt with incremental value 0.1, and vector y1 and y2

matlab question image text in transcribed
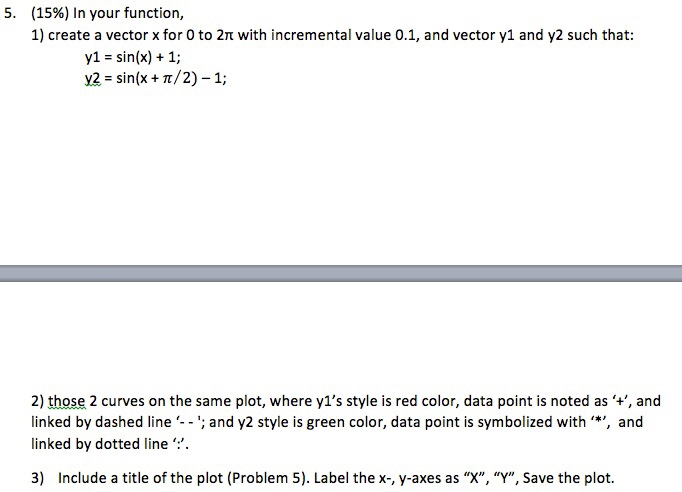
5. (15%) in your function, 1) create a vector x for 0 to 2nt with incremental value 0.1, and vector y1 and y2 such that: y1 = sin(x) + 1; y2 = sin(x + 1/2) - 1; 2) those 2 curves on the same plot, where yl's style is red color, data point is noted as '+', and linked by dashed line'--'; and y2 style is green color, data point is symbolized with '*', and linked by dotted line''. 3) Include a title of the plot (Problem 5). Label the x-, y-axes as "X", "Y", Save the plot

Step by Step Solution

There are 3 Steps involved in it

Step: 1

blur-text-image
Get Instant Access to Expert-Tailored Solutions

See step-by-step solutions with expert insights and AI powered tools for academic success

Step: 2

blur-text-image_2

Step: 3

blur-text-image_3

Ace Your Homework with AI

Get the answers you need in no time with our AI-driven, step-by-step assistance

Get Started

Recommended Textbook for

Structured Search For Big Data From Keywords To Key-objects

Authors: Mikhail Gilula

1st Edition

012804652X, 9780128046524

More Books

Students explore these related Databases questions