Answered step by step
Verified Expert Solution
Link Copied!

Question

1 Approved Answer

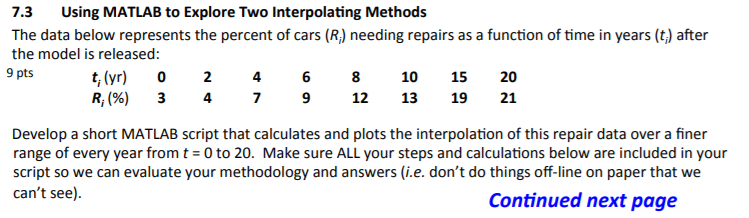
Matlab question 7.3 Using MATLAB to Explore Two Interpolating Methods The data below represents the percent of cars (R) needing repairs as a function of

image text in transcribed

Matlab questionimage text in transcribed

7.3 Using MATLAB to Explore Two Interpolating Methods The data below represents the percent of cars (R) needing repairs as a function of time in years (t) after the model is released: 9 pts t, (yr) 2 46810 15 20 R. (%) 3 4 9 12 13 19 21 Develop a short MATLAB script that calculates and plots the interpolation of this repair data over a finer range of every year from t = 0 to 20. Make sure ALL your steps and calculations below are included in your script so we can evaluate your methodology and answers (i.e. don't do things off-line on paper that we can't see) Continued next page Start by creating a new vector of time: tnew [0:20]. Now create three new vectors that interpolate the data over tnew using each of three different methods: a) Exact Polynomial: Use polyfit to calculate the single polynomial that exactly fits all eight data points, and polyval to evaluate it over the tnew vector. b) Linear Spline: Use interpl with the "linear" option Cubic Spline: Use interpl with the "spline" option (which defaults to a cubic spline with "not-a- knot" end conditions). Make a single plot with the raw data (as circles) plus all three interpolated lines, where exact polynomial line (a) is dashed red, linear spline (b) is solid black, cubic spline (c) is dash-dot blue, maybe using something similar to the command below: plot (ti, Ri, 'ok', tnew, Ra,',tnew,Rb,-k', tnew, Rc,'-.b') constrain the plot over 0 Repair % 25 and 0 time 20 with the command axis ( [0 20 0 25] ) . Finally, interrogate the plot and the interpolated vectors over the range in tnew to answer the following questions: i. What does each model say the interpolated repair rate is at t 3 years? ii. What does each model say the interpolated repair rate is at t- 18 years? iii. If you trust the data 100%, use the plot and your engineering judgment to determine which model you think did the best job at interpolating the data over the entire range

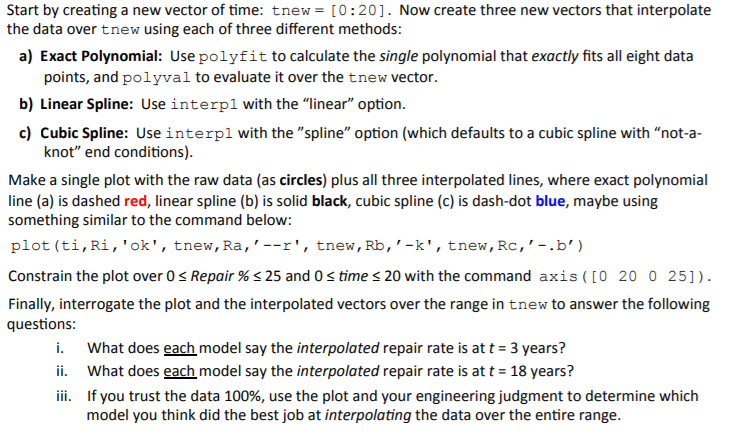
Step by Step Solution

There are 3 Steps involved in it

Step: 1

blur-text-image

Get Instant Access to Expert-Tailored Solutions

See step-by-step solutions with expert insights and AI powered tools for academic success

Step: 2

blur-text-image

Step: 3

blur-text-image

Ace Your Homework with AI

Get the answers you need in no time with our AI-driven, step-by-step assistance

Get Started

Recommended Textbook for

More Books

Students also viewed these Databases questions