

Question
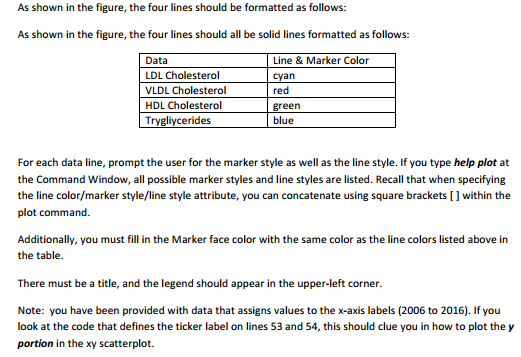
MATLAB question See the four attached pictures at the bottom. Note that the .csv file is simply the numVal Array table shown on the first
MATLAB question
See the four attached pictures at the bottom. Note that the .csv file is simply the numVal Array table shown on the first image, in Excel. The graphCholSpring2017.m code starts as this:
oneLine = ' '; i=1; numVal = [];
%Open comma-separated file fh = fopen('CholesterolSpring2017.csv', 'r');
%Read in one line at a time and build the numVal array while ~feof(fh) oneLine = fgetl(fh); token = textscan(oneLine,'%d','delimiter', ','); numVal = [numVal token{i}]; end %%%%%%%%%%%%%%%%%%%%%%%%%%%%%%%%%%%%%%%%%%%%%%%%%%%%%%%%%%%%%%%%%%%
%Define length of x - look at the data file (how many points on each line) % x = 1: length(numVal); %Add title % title('Cholesterol Spring 2017');
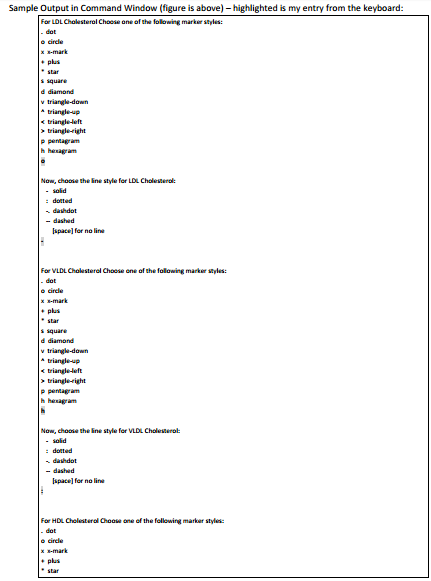
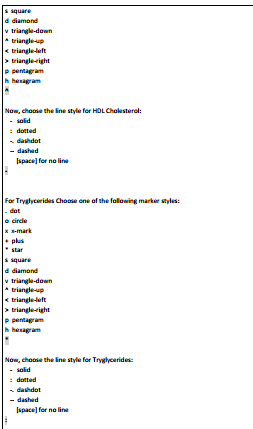
%Prompt for the four line colors and styles menu1 = ['Choose one of the following marker styles: ',... ' . dot',... ' o circle',... ... ' h hexagram '];
menu2 = ...
marker1 = input(...); style1 = input(...);
marker2 = ... style2 = ...
marker3 = ... style3 = ...
marker4 = ... style4 = ...
%Prompt for one line width to be used for all 4 lines %%%%%%%%%%%%%%%%%%%%%%%%%%%%%%%%%%%%%%%%%%%%%%%%%%%%%%%%%%%%%%%%%%%
set(gca,'XTick',1:length(numVal)); set(gca,'XTickLabel',numVal(1,:));
%%%%%%%%%%%%%%%%%%%%%%%%%%%%%%%%%%%%%%%%%%%%%%%%%%%%%%%%%%%%%%%%%%%%%
%On SAME graph, plot Triglycerides, HDL Cholesterol, %VLDL Cholesterol, and LDL Cholesterol %Use both the line color and style as entered by user), %Use marker style according to lab instructions %Marker face colors must be filled in and the same as the line color % %Add a legend in upperright corner
%%%%%%%%%%%%%%%%%%%%%%%%%%%%%%%%%%%%%%%%%%%%%%%%%%%%%%%%%%%%%%%%%%%%%
As you can see, I am missing A LOT of information in the script. I am extremely confused and have no clue how to solve this. Thank you sincerely for the help...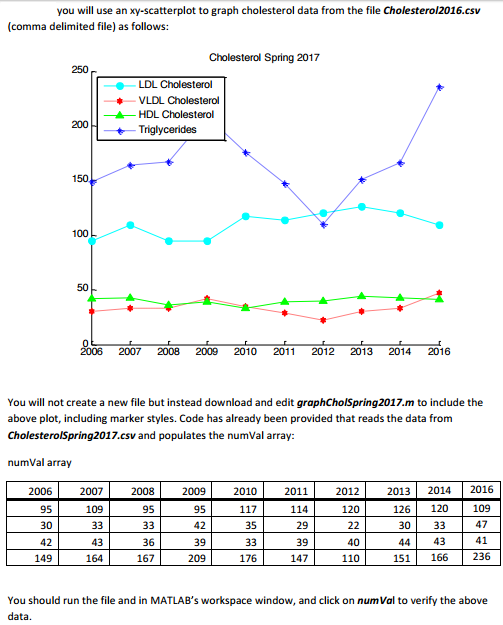
Step by Step Solution
There are 3 Steps involved in it
Step: 1

Get Instant Access to Expert-Tailored Solutions
See step-by-step solutions with expert insights and AI powered tools for academic success
Step: 2

Step: 3
Ace Your Homework with AI
Get the answers you need in no time with our AI-driven, step-by-step assistance
Get Started
Next Generation Databases NoSQLand Big Data
Authors: Guy Harrison
1st Edition
1484213300, 978-1484213308