Answered step by step
Verified Expert Solution
Question
1 Approved Answer
matlab Task 1 -- Data fitting - (Taskim) (14) For a set of negative temperature coefficient thermistors the characteristics are given in the file NTC.csv
matlab 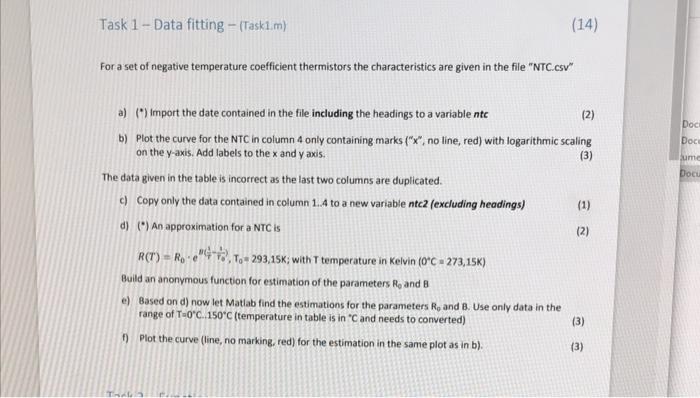
Task 1 -- Data fitting - (Taskim) (14) For a set of negative temperature coefficient thermistors the characteristics are given in the file "NTC.csv" Doc (boce ume Doc a) (+) Import the date contained in the file including the headings to a variable ntc (2) b) Plot the curve for the NTC in column 4 only containing marks ("x", no line, red) with logarithmic scaling on the y-axis. Add labels to the x and y axis. (3) The data given in the table is incorrect as the last two columns are duplicated. c) copy only the data contained in column 1.4 to a new variable ntc2 (excluding headings) (1) d)) An approximation for a NTC is (2) R(T) = R.-"48,7o+293,15K; with T temperature in Kelvin (0C = 273,15K) Build an anonymous function for estimation of the parameters R, and B e) Based on d) now let Matlab find the estimations for the parameters R, and B. Use only data in the range of T=0C.150C (temperature in table is in C and needs to converted) (3) Plot the curve (line, no marking, red) for the estimation in the same plot as in b). (3) Task 1 -- Data fitting - (Taskim) (14) For a set of negative temperature coefficient thermistors the characteristics are given in the file "NTC.csv" Doc (boce ume Doc a) (+) Import the date contained in the file including the headings to a variable ntc (2) b) Plot the curve for the NTC in column 4 only containing marks ("x", no line, red) with logarithmic scaling on the y-axis. Add labels to the x and y axis. (3) The data given in the table is incorrect as the last two columns are duplicated. c) copy only the data contained in column 1.4 to a new variable ntc2 (excluding headings) (1) d)) An approximation for a NTC is (2) R(T) = R.-"48,7o+293,15K; with T temperature in Kelvin (0C = 273,15K) Build an anonymous function for estimation of the parameters R, and B e) Based on d) now let Matlab find the estimations for the parameters R, and B. Use only data in the range of T=0C.150C (temperature in table is in C and needs to converted) (3) Plot the curve (line, no marking, red) for the estimation in the same plot as in b). (3) Step by Step Solution
There are 3 Steps involved in it
Step: 1

Get Instant Access to Expert-Tailored Solutions
See step-by-step solutions with expert insights and AI powered tools for academic success
Step: 2

Step: 3
Ace Your Homework with AI
Get the answers you need in no time with our AI-driven, step-by-step assistance
Get Started