Answered step by step
Verified Expert Solution
Link Copied!

Question

1 Approved Answer

Matlab () The gain versus freguency of a capacitive coupled amplifier is shown below. Draw a graph of gain versus frequency using logarithmic seale for

Matlab image text in transcribed
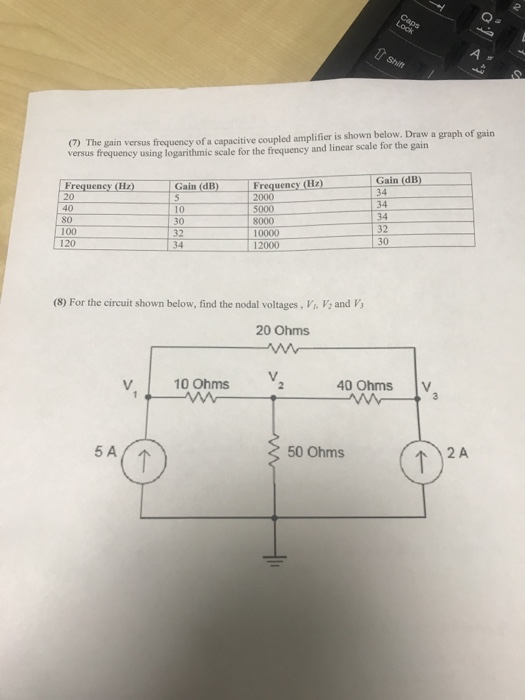
() The gain versus freguency of a capacitive coupled amplifier is shown below. Draw a graph of gain versus frequency using logarithmic seale for the frequency and linear scale for the gain Gain (dB) Frequency (Hz) Gain (dB) Frequency (Hz) 20 40 80 100 120 34 34 34 32 30 10 30 32 8000 10000 12000 (8) For the circuit shown below, find the nodal voltages, Vi. V2 and Vs 20 Ohms 10 Ohms 40 Ohms V 5 A 50 Ohms 2 A

Step by Step Solution

There are 3 Steps involved in it

Step: 1

blur-text-image

Get Instant Access to Expert-Tailored Solutions

See step-by-step solutions with expert insights and AI powered tools for academic success

Step: 2

blur-text-image

Step: 3

blur-text-image

Ace Your Homework with AI

Get the answers you need in no time with our AI-driven, step-by-step assistance

Get Started

Recommended Textbook for

Pro PowerShell For Database Developers

Authors: Bryan P Cafferky

1st Edition

1484205413, 9781484205419

More Books

Students also viewed these Databases questions

Question

Describe the differences between ETFs and mutual funds.

Answered: 1 week ago

Question

What is the difference between Needs and GAP Analyses?

Answered: 1 week ago

Question

What are ERP suites? Are HCMSs part of ERPs?

Answered: 1 week ago