Answered step by step
Verified Expert Solution
Question
1 Approved Answer
Matlab The histogram of N random realizations of a random variable is essentially an approximation of the probability distribution for that random variable, except for
Matlab
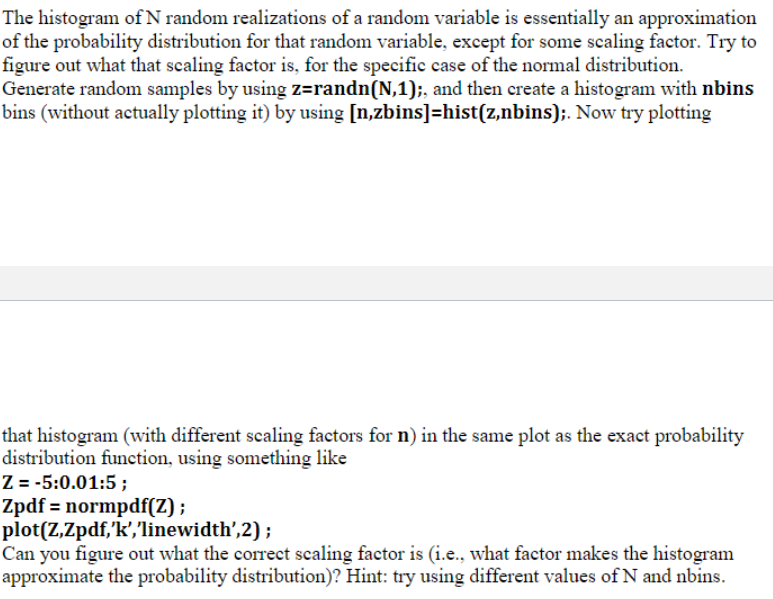
The histogram of N random realizations of a random variable is essentially an approximation of the probability distribution for that random variable, except for some scaling factor. Try to figure out what that scaling factor is, for the specific case of the normal distribution Generate random samples by using z-randn(N,1);, and then create a histogram with nbins bins (without actually plotting it) by using [n,zbins]-hist(z.nbins);. Now try plotting that histogram (with different scaling factors for n) in the same plot as the exact probability distribution function, using something like Z =-5:0.015; Zpdf- normpdf(Z); plot(Z,Zpdf,'k','linewidth',2); Can you figure out what the correct scaling factor is (i.e., what factor makes the histogram approximate the probability distribution? Hint: try using different values of N and nbinsStep by Step Solution
There are 3 Steps involved in it
Step: 1
Get Instant Access to Expert-Tailored Solutions
See step-by-step solutions with expert insights and AI powered tools for academic success
Step: 2
Step: 3
Ace Your Homework with AI
Get the answers you need in no time with our AI-driven, step-by-step assistance
Get Started