Matlab... there is an excel file called neuronData.xlsx

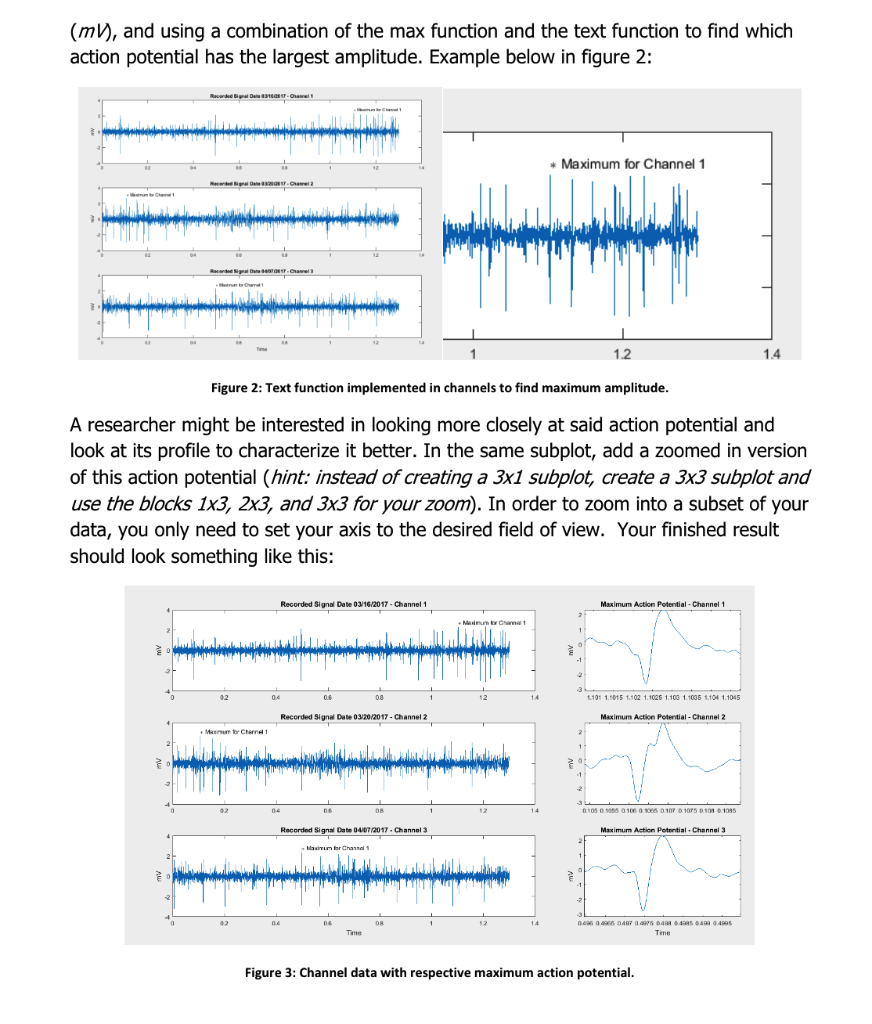


Background: In this project you will be working with neurological data collected inside a subject's brain. This data has 3 channels and 25,000 values that represent the microvoltages at the cellular level (neuronal) (Figure 1). You will use what you have learned to summarize the information contained in these three channels using plotting and data analysis. Action potential Microelectr Failed 70 Time (ms) Figure 1: Neurons and microelectrode recording an action potential In the assignment section of Carmen you will find the necessary data for this project (file: neuronData.xlsx). The data array contains 3 columns of 25,000 values each.; each column contains the data from one microelectrode. These 25,000 samples were taken in a span from 0 to 1.3 seconds. Task 1: Write a function to plot the 3 channels of data on a single graph using a subplot Function Specification Input Arguments: The data array (a matrix) The sampling interval (time between samples), a scalar [You can easily figure this out from the provided information above.] . Output Arguments: None Make a summary plot showing the three different channels with the shared time axis (hint. use a subplot). The channels should be properly labeled showing the date of the recording (Channel 1 - 3/16/17, Channel 2 - 3/20/17, Channel 3- 4/07/17), the units (mV), and using a combination of the max function and the text function to find which action potential has the largest amplitude. Example below in figure 2: Maximum for Channel 1 1.2 Figure 2: Text function implemented in channels to find maximum amplitude A researcher might be interested in looking more closely at said action potential and look at its profile to characterize it better. In the same subplot, add a zoomed in version of this action potential (hint: instead of creating a 3x1 subplot, create a 3x3 subplot and use the blocks 1x3, 2x3, and 3x3 for your zoom). In order to zoom into a subset of your data, you only need to set your axis to the desired field of view. Your finished result should look something like this: Recorded Signal Date 03/16/2017- Channel 1 Maximum Action Potential-Channel 1 0 1015 1. 102 1.1026 1.1035 1.1 1045 Recorded Signal Dabe 03/20/2017- Channel 2 Maximum Action Petential -Chennel 2 05 0 505 106 0109 1095 Racorded Signal Date 04/07/12017 Channel 3 Maximum Action Potential Channel 3 496 0 Time Figure 3: Channel data with respective maximum action potential Function Specification Input Arguments: The data array containing the 3 channels of spike data The sampling period (time between samples) of the data (a scalar) The threshold voltage (in mV) for a spike (a scalar) Output Arguments: A 1x3 array with the number of spikes above the threshold value in each channel A 1x3 array with the average peak height in each channel A 1x3 array with the maximum peak height in each channel A 1x3 array with the average time between spikes A 1x3 array containing the correlation coefficient for each pair of channels, in the following order: (1,2), (1,3), (2,3). The correlation coefficient is defined below . Additional Output: A 3x1 subplot containing histograms of the spike heights in each channel . Create a new figure window so that the previous plot is not overwritten . By trial and error, choose an appropriate number of bins so that the distribution is displayed with a suitable level of detail Using line) and text (), place a vertical line on each histogram showing the mean, and label it with the value of the mean. (Hint: use num2str or sprintf) . For example, if the function is called analyze spikes, and the sampling interval is 10 microseconds, a call might look like this: numSpikes, avgHeight, maxHeight, avgTime, corrCoeff] - analyze_spikes (spikeData, 10e-6, 1.0) Remember that the output arguments are 1x3 arrays. To find the number of peaks above the threshold, you can use the Matlab built-in function findpeaks ), for example: [peak-vals, peak-ind] findpeaks (data, 'MinPeakHeight',1) = This function will give you the peaks in a recording that are above 1 unit of measure (in this case mV); peak_vals is an array containing the maximum value of each peak, and peak_ind is an array containing the index at which each peak value occurs. Correlation is a measure of how likely two neurons are to fire at the same time. For purposes of this project, the correlation between two channels is calculated in the following (simplified) manner:1 For each peak in the first channel, if the second channel is above threshold at the time of that peak, the overlap for that peak is 1; otherwise it is zero The correlation between channels i and j is then defined as: . i,j where: OLJ == Sum of overlaps of channel j with channel i NiNumber of Peaks in channel i Note: OLij is not necessarily equal to OL, but Cij is always equal Ci The concept of the overlap between two channels is illustrated in Figure 4. At the time of a given peak in channel 1, channel 2 is above threshold, so overlap (1,2)-1. At the same time, channel 3 is below threshold, so overlap (1,3)-0. To get OL1,2 or OL13, you must SUM the overlaps over all of channel 1's peaks. The degree of correlation will depend on the threshold value; the higher the threshold, the lower the correlation. Note that if i and j are the same channel, the correlation is 1.0 While this calculation may sound complicated, it can be done in one line in Matlab with logical array operations. Max Signal - Channel 1 0.076 0078 00 0.082 0.084 Max Signal-Channel 2 Chan 2 is >Vt 2Overlp(12)1 Chan 1 peak 0076 0078 oo 0082 0084 Max Signal-Channel 3 2 Chan 3 is
Vt 2Overlp(12)1 Chan 1 peak 0076 0078 oo 0082 0084 Max Signal-Channel 3 2 Chan 3 is