

Answered step by step
Verified Expert Solution
Question
1 Approved Answer
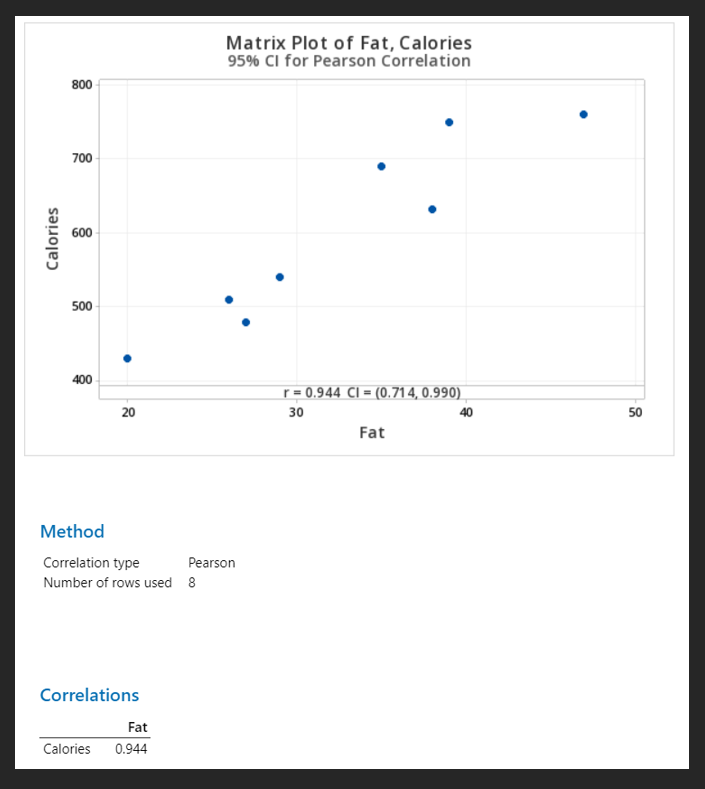
Matrix Plot of Fat, Calories 95% CI for Pearson Correlation 800 700 600 Calories 500 400 r = 0.944 CI = (0. 71 4, 0.990)
Step by Step Solution
There are 3 Steps involved in it
Step: 1

Get Instant Access to Expert-Tailored Solutions
See step-by-step solutions with expert insights and AI powered tools for academic success
Step: 2

Step: 3
Ace Your Homework with AI
Get the answers you need in no time with our AI-driven, step-by-step assistance
Get Started
College Algebra And Trigonometry A Unit Circle Approach,
Authors: Mark Dugopolski
6th Edition
0321867564, 9780321867568