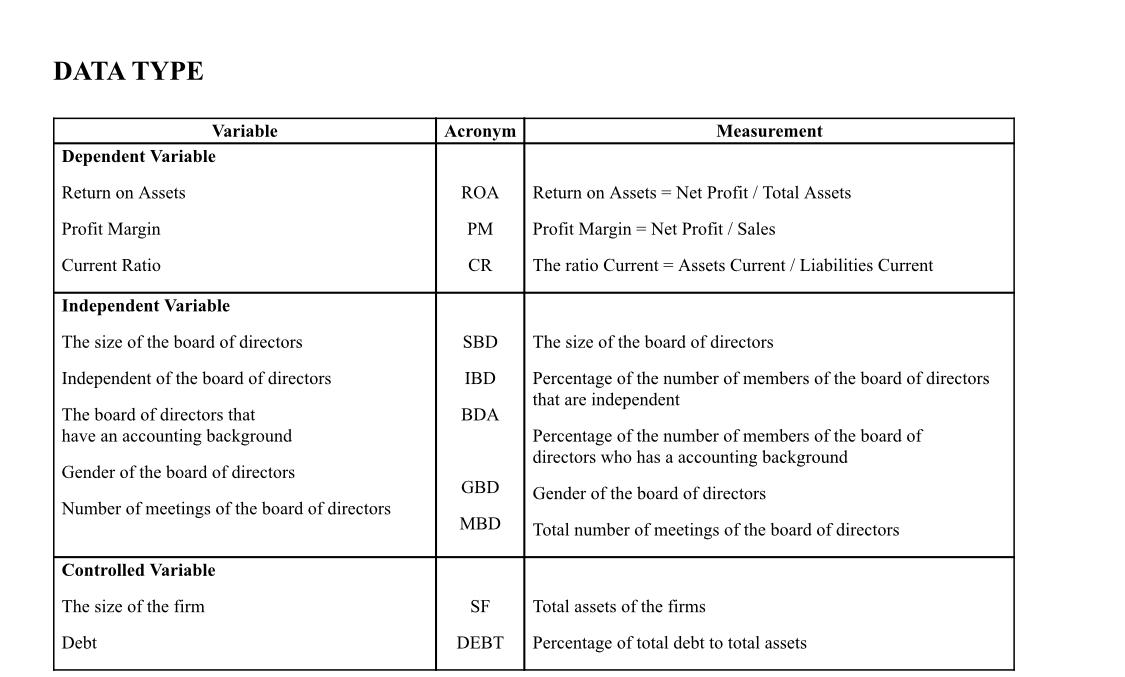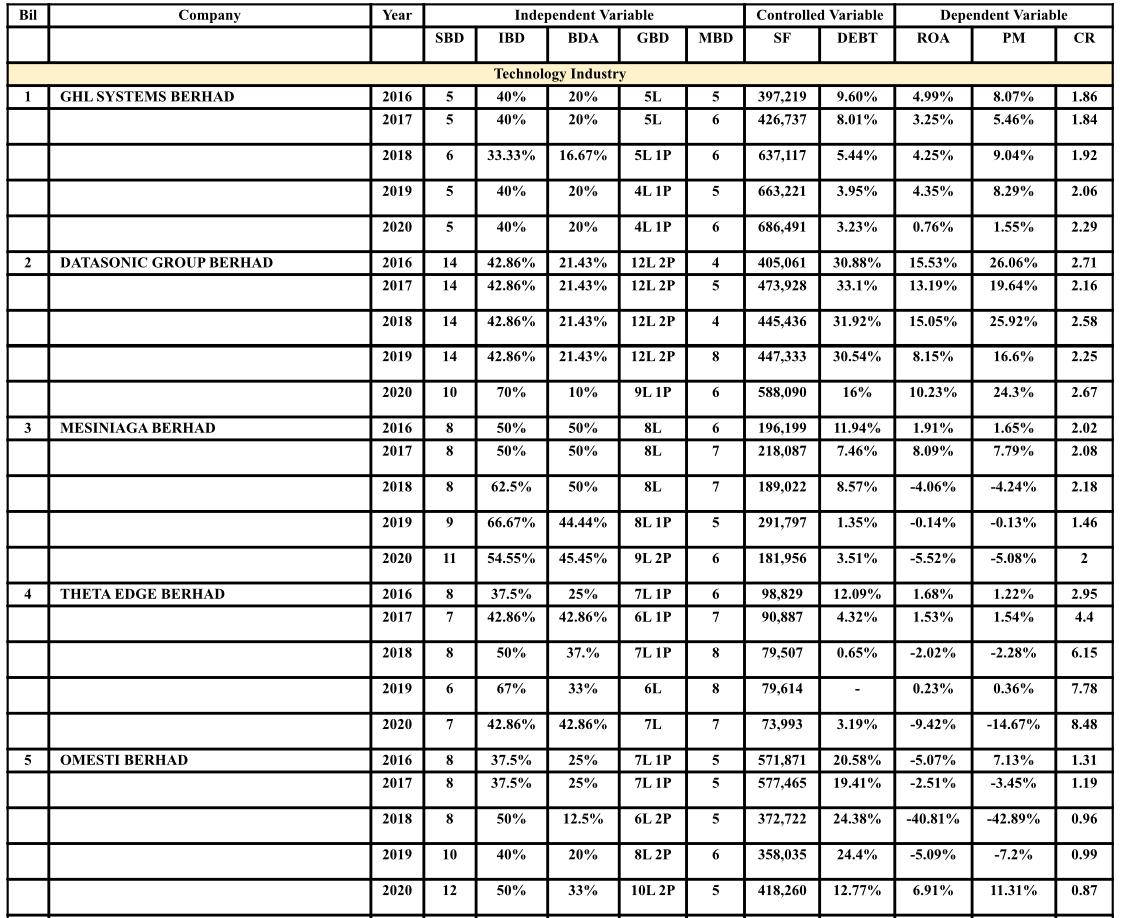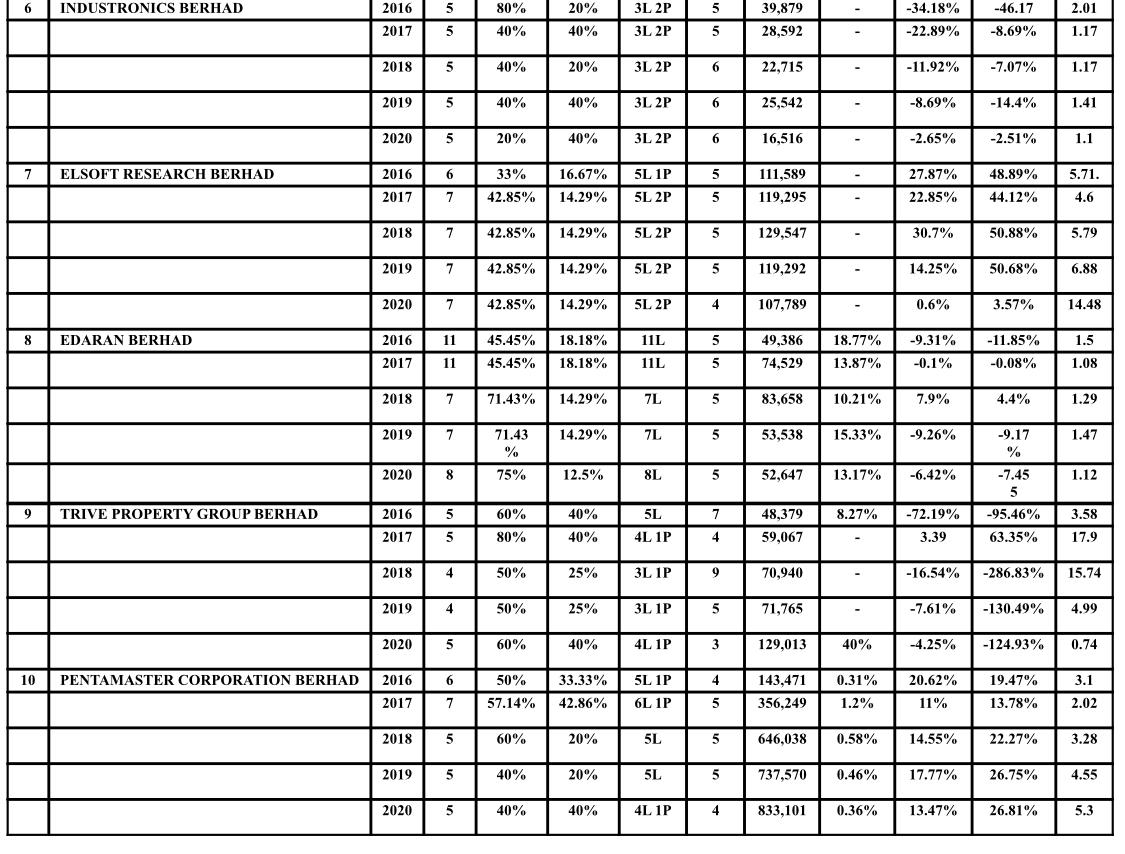

 May I ask how to analyse this data in SPSS? What data analysis should be done
DATA TYPE Acronym Measurement Variable Dependent Variable Return on Assets ROA Return on Assets = Net Profit / Total Assets Profit Margin PM Profit Margin = Net Profit/ Sales Current Ratio CR The ratio Current = Assets Current/Liabilities Current Independent Variable The size of the board of directors SBD The size of the board of directors Independent of the board of directors IBD BDA The board of directors that have an accounting background Percentage of the number of members of the board of directors that are independent Percentage of the number of members of the board of directors who has a accounting background Gender of the board of directors Gender of the board of directors GBD Number of meetings of the board of directors MBD Total number of meetings of the board of directors Controlled Variable The size of the firm SF Total assets of the firms Debt DEBT Percentage of total debt to total assets Bil Company Year Independent Variable IBD BDA GBD Controlled Variable SF DEBT Dependent Variable ROA PM CR SBD MBD 1 GHL SYSTEMS BERHAD 2016 2017 5. Technology Industry 40% 20% 40% 20% 5 5 5L 5L 397,219 426,737 9.60% 8.01% 4.99% 3.25% 8.07% 5.46% 1.86 1.84 6 2018 6 33.33% 16.67% 5L 1P 6 637,117 5.44% 4.25% 9.04% 1.92 2019 5 40% 20% 4L 1P 5 663.221 3.95% 4.35% 8.29% 2.06 2020 5 40% 20% 4L 1P 6 686,491 3.23% 0.76% 1.55% 2.29 2 DATASONIC GROUP BERHAD 2016 14 4 15.53% 42.86% 42.86% 21.43% 21.43% 12L 2P 12L 2P 405,061 473,928 30.88% 33.1% 26.06% 19.64% 2.71 2.16 2017 14 13.19% 2018 14 42.86% 21.43% 12L 2P 4 4 445,436 31.92% 15.05% 25.92% 2.58 2019 14 42.86% 21.43% 12L 2P 8 447,333 30.54% 8.15% 16.6% 2.25 2020 10 70% 10% 9L 1P 6 588,090 16% 10.23% 24.3% 2.67 3 MESINIAGA BERHAD 8 50% 6 11.94% 2016 2017 50% 50% 8L 8L 196,199 218,087 1.91% 8.09% 1.65% 7.79% 2.02 2.08 8 50% 7 7.46% 2018 8 62.5% 50% 8L 7 189,022 8.57% -4.06% -4.24% 2.18 5 2019 9 66.67% 44.44% 8L 1P 5 291,797 1.35% -0.14% -0.13% 1.46 2020 11 54.55% 45.45% 9L 2P 6 181.956 3.51% -5.52% -5.08% 2 4 THETA EDGE BERHAD 2016 8 37.5% 25% 6 98.829 2.95 7L 1P 6L 1P 12.09% 4.32% 1.68% 1.53% 1.22% 1.54% 95 2017 7 42.86% 42.86% 7 90.887 4.4 2018 8 50% 37.% 7L 1P 8 79,507 0.65% -2.02% -2.28% 6.15 2019 6 67% 33% 6L 8 79,614 0.23% 0.36% 7.78 2020 7 42.86% 42.86% 7L 7 73,993 3.19% -9.42% -14.67% 8.48 5 OMESTI BERHAD 2016 8 37.5% 5 571,871 1.31 25% 25% 7L 1P 7L 1P 20.58% 19.41% -5.07% -2.51% 7.13% -3.45% 2017 8 37.5% 5 577,465 1.19 2018 8 50% 12.5% 6L 2P 5 372,722 24.38% -40.81% -42.89% 0.96 2019 10 40% 20% 8L 2P 6 358,035 24.4% -5.09% -7.2% 0.99 2020 12 50% 33% 10L 2P 5 418,260 12.77% 6.91% 11.31% 0.87 6 INDUSTRONICS BERHAD 5 20% 5 2.01 2016 2017 80% 40% 3L 2P 3L 2P 39,879 28,592 -34.18% -22.89% -46.17 -8.69% 5 40% 5 - 1.17 2018 5 40% 20% 3L 2P al 6 22,715 - -11.92% -7.07% 1.17 2019 5 40% 40% 3L 2P 6 25,542 -8.69% -14.4% 1.41 31 2020 5 20% 40% 3L 2P 6 16,516 -2.65% -2.51% 1.1 5 ; ULT 7 ELSOFT RESEARCH BERHAD 2016 6 6 33% 5 111,589 48.89% 5.71. 16.67% 14.29% 5L 1P 5L 2P 27.87% 22.85% 2017 7 42.85% 5 119,295 44.12% 4.6 2018 7 42.85% 14.29% 5L 2P 5 129,547 30.7% 50.88% 5.79 2019 7 42.85% 14.29% 5L 2P 5 119,292 14.25% 50.68% 6.88 2020 7 42.85% 14.29% 5L 2P 4 107,789 0.6% 3.57% 14.48 8 8 EDARAN BERHAD 11L 5 49,386 2016 2017 11 11 45.45% 45.45% 18.18% 18.18% 18.77% 13.87% -9.31% -0.1% -11.85% -0.08% 1.5 1.5 1.08 11L 5 74,529 2018 7 71.43% 14.29% 7L 5 83,658 10.21% 7.9% 4.4% 1.29 2019 7 14.29% 7L 5 53,538 15.33% -9.26% 71.43 % 1.47 2020 8 75% 12.5% 8L 5 52,647 13.17% -6.42% 1.12 -9.17 % -7.45 5 -95.46% 63.35% 9 TRIVE PROPERTY GROUP BERHAD 2016 " 5 60% 40% 7 5L 4L 1P - 8.27% 48.379 59,067 - 72.19% 3.39 3.58 17.9 2017 5 80% 40% 4 2018 4 50% 25% 3L 1P 9 70,940 - -16.54% -286.83% 15.74 2019 4 50% 25% 3L 1P 5 71,765 -7.61% -130.49% 4.99 2020 5 60% 40% 4L 1P 3 129,013 40% -4.25% -124.93% 0.74 10 PENTAMASTER CORPORATION BERHAD 6 50% 4 20.62% 19.47% 3.1 2016 2017 33.33% 42.86% 5L 1P 6L 1P 143,471 356,249 0.31% 1.2% 7 57.14% 5 5 11% 13.78% 2.02 2018 5 60% 20% 5L 5 646,038 0.58% 14.55% 22.27% 3.28 2019 5 40% 20% 5L 5 737,570 0.46% 17.77% 26.75% 4.55 2020 5 40% 40% 4L 1P 4 4 833,101 0.36% 13.47% 26.81% 5.3 DATA TYPE Acronym Measurement Variable Dependent Variable Return on Assets ROA Return on Assets = Net Profit / Total Assets Profit Margin PM Profit Margin = Net Profit/ Sales Current Ratio CR The ratio Current = Assets Current/Liabilities Current Independent Variable The size of the board of directors SBD The size of the board of directors Independent of the board of directors IBD BDA The board of directors that have an accounting background Percentage of the number of members of the board of directors that are independent Percentage of the number of members of the board of directors who has a accounting background Gender of the board of directors Gender of the board of directors GBD Number of meetings of the board of directors MBD Total number of meetings of the board of directors Controlled Variable The size of the firm SF Total assets of the firms Debt DEBT Percentage of total debt to total assets Bil Company Year Independent Variable IBD BDA GBD Controlled Variable SF DEBT Dependent Variable ROA PM CR SBD MBD 1 GHL SYSTEMS BERHAD 2016 2017 5. Technology Industry 40% 20% 40% 20% 5 5 5L 5L 397,219 426,737 9.60% 8.01% 4.99% 3.25% 8.07% 5.46% 1.86 1.84 6 2018 6 33.33% 16.67% 5L 1P 6 637,117 5.44% 4.25% 9.04% 1.92 2019 5 40% 20% 4L 1P 5 663.221 3.95% 4.35% 8.29% 2.06 2020 5 40% 20% 4L 1P 6 686,491 3.23% 0.76% 1.55% 2.29 2 DATASONIC GROUP BERHAD 2016 14 4 15.53% 42.86% 42.86% 21.43% 21.43% 12L 2P 12L 2P 405,061 473,928 30.88% 33.1% 26.06% 19.64% 2.71 2.16 2017 14 13.19% 2018 14 42.86% 21.43% 12L 2P 4 4 445,436 31.92% 15.05% 25.92% 2.58 2019 14 42.86% 21.43% 12L 2P 8 447,333 30.54% 8.15% 16.6% 2.25 2020 10 70% 10% 9L 1P 6 588,090 16% 10.23% 24.3% 2.67 3 MESINIAGA BERHAD 8 50% 6 11.94% 2016 2017 50% 50% 8L 8L 196,199 218,087 1.91% 8.09% 1.65% 7.79% 2.02 2.08 8 50% 7 7.46% 2018 8 62.5% 50% 8L 7 189,022 8.57% -4.06% -4.24% 2.18 5 2019 9 66.67% 44.44% 8L 1P 5 291,797 1.35% -0.14% -0.13% 1.46 2020 11 54.55% 45.45% 9L 2P 6 181.956 3.51% -5.52% -5.08% 2 4 THETA EDGE BERHAD 2016 8 37.5% 25% 6 98.829 2.95 7L 1P 6L 1P 12.09% 4.32% 1.68% 1.53% 1.22% 1.54% 95 2017 7 42.86% 42.86% 7 90.887 4.4 2018 8 50% 37.% 7L 1P 8 79,507 0.65% -2.02% -2.28% 6.15 2019 6 67% 33% 6L 8 79,614 0.23% 0.36% 7.78 2020 7 42.86% 42.86% 7L 7 73,993 3.19% -9.42% -14.67% 8.48 5 OMESTI BERHAD 2016 8 37.5% 5 571,871 1.31 25% 25% 7L 1P 7L 1P 20.58% 19.41% -5.07% -2.51% 7.13% -3.45% 2017 8 37.5% 5 577,465 1.19 2018 8 50% 12.5% 6L 2P 5 372,722 24.38% -40.81% -42.89% 0.96 2019 10 40% 20% 8L 2P 6 358,035 24.4% -5.09% -7.2% 0.99 2020 12 50% 33% 10L 2P 5 418,260 12.77% 6.91% 11.31% 0.87 6 INDUSTRONICS BERHAD 5 20% 5 2.01 2016 2017 80% 40% 3L 2P 3L 2P 39,879 28,592 -34.18% -22.89% -46.17 -8.69% 5 40% 5 - 1.17 2018 5 40% 20% 3L 2P al 6 22,715 - -11.92% -7.07% 1.17 2019 5 40% 40% 3L 2P 6 25,542 -8.69% -14.4% 1.41 31 2020 5 20% 40% 3L 2P 6 16,516 -2.65% -2.51% 1.1 5 ; ULT 7 ELSOFT RESEARCH BERHAD 2016 6 6 33% 5 111,589 48.89% 5.71. 16.67% 14.29% 5L 1P 5L 2P 27.87% 22.85% 2017 7 42.85% 5 119,295 44.12% 4.6 2018 7 42.85% 14.29% 5L 2P 5 129,547 30.7% 50.88% 5.79 2019 7 42.85% 14.29% 5L 2P 5 119,292 14.25% 50.68% 6.88 2020 7 42.85% 14.29% 5L 2P 4 107,789 0.6% 3.57% 14.48 8 8 EDARAN BERHAD 11L 5 49,386 2016 2017 11 11 45.45% 45.45% 18.18% 18.18% 18.77% 13.87% -9.31% -0.1% -11.85% -0.08% 1.5 1.5 1.08 11L 5 74,529 2018 7 71.43% 14.29% 7L 5 83,658 10.21% 7.9% 4.4% 1.29 2019 7 14.29% 7L 5 53,538 15.33% -9.26% 71.43 % 1.47 2020 8 75% 12.5% 8L 5 52,647 13.17% -6.42% 1.12 -9.17 % -7.45 5 -95.46% 63.35% 9 TRIVE PROPERTY GROUP BERHAD 2016 " 5 60% 40% 7 5L 4L 1P - 8.27% 48.379 59,067 - 72.19% 3.39 3.58 17.9 2017 5 80% 40% 4 2018 4 50% 25% 3L 1P 9 70,940 - -16.54% -286.83% 15.74 2019 4 50% 25% 3L 1P 5 71,765 -7.61% -130.49% 4.99 2020 5 60% 40% 4L 1P 3 129,013 40% -4.25% -124.93% 0.74 10 PENTAMASTER CORPORATION BERHAD 6 50% 4 20.62% 19.47% 3.1 2016 2017 33.33% 42.86% 5L 1P 6L 1P 143,471 356,249 0.31% 1.2% 7 57.14% 5 5 11% 13.78% 2.02 2018 5 60% 20% 5L 5 646,038 0.58% 14.55% 22.27% 3.28 2019 5 40% 20% 5L 5 737,570 0.46% 17.77% 26.75% 4.55 2020 5 40% 40% 4L 1P 4 4 833,101 0.36% 13.47% 26.81% 5.3


 May I ask how to analyse this data in SPSS? What data analysis should be done


