may i have assistance on better understanding this problem
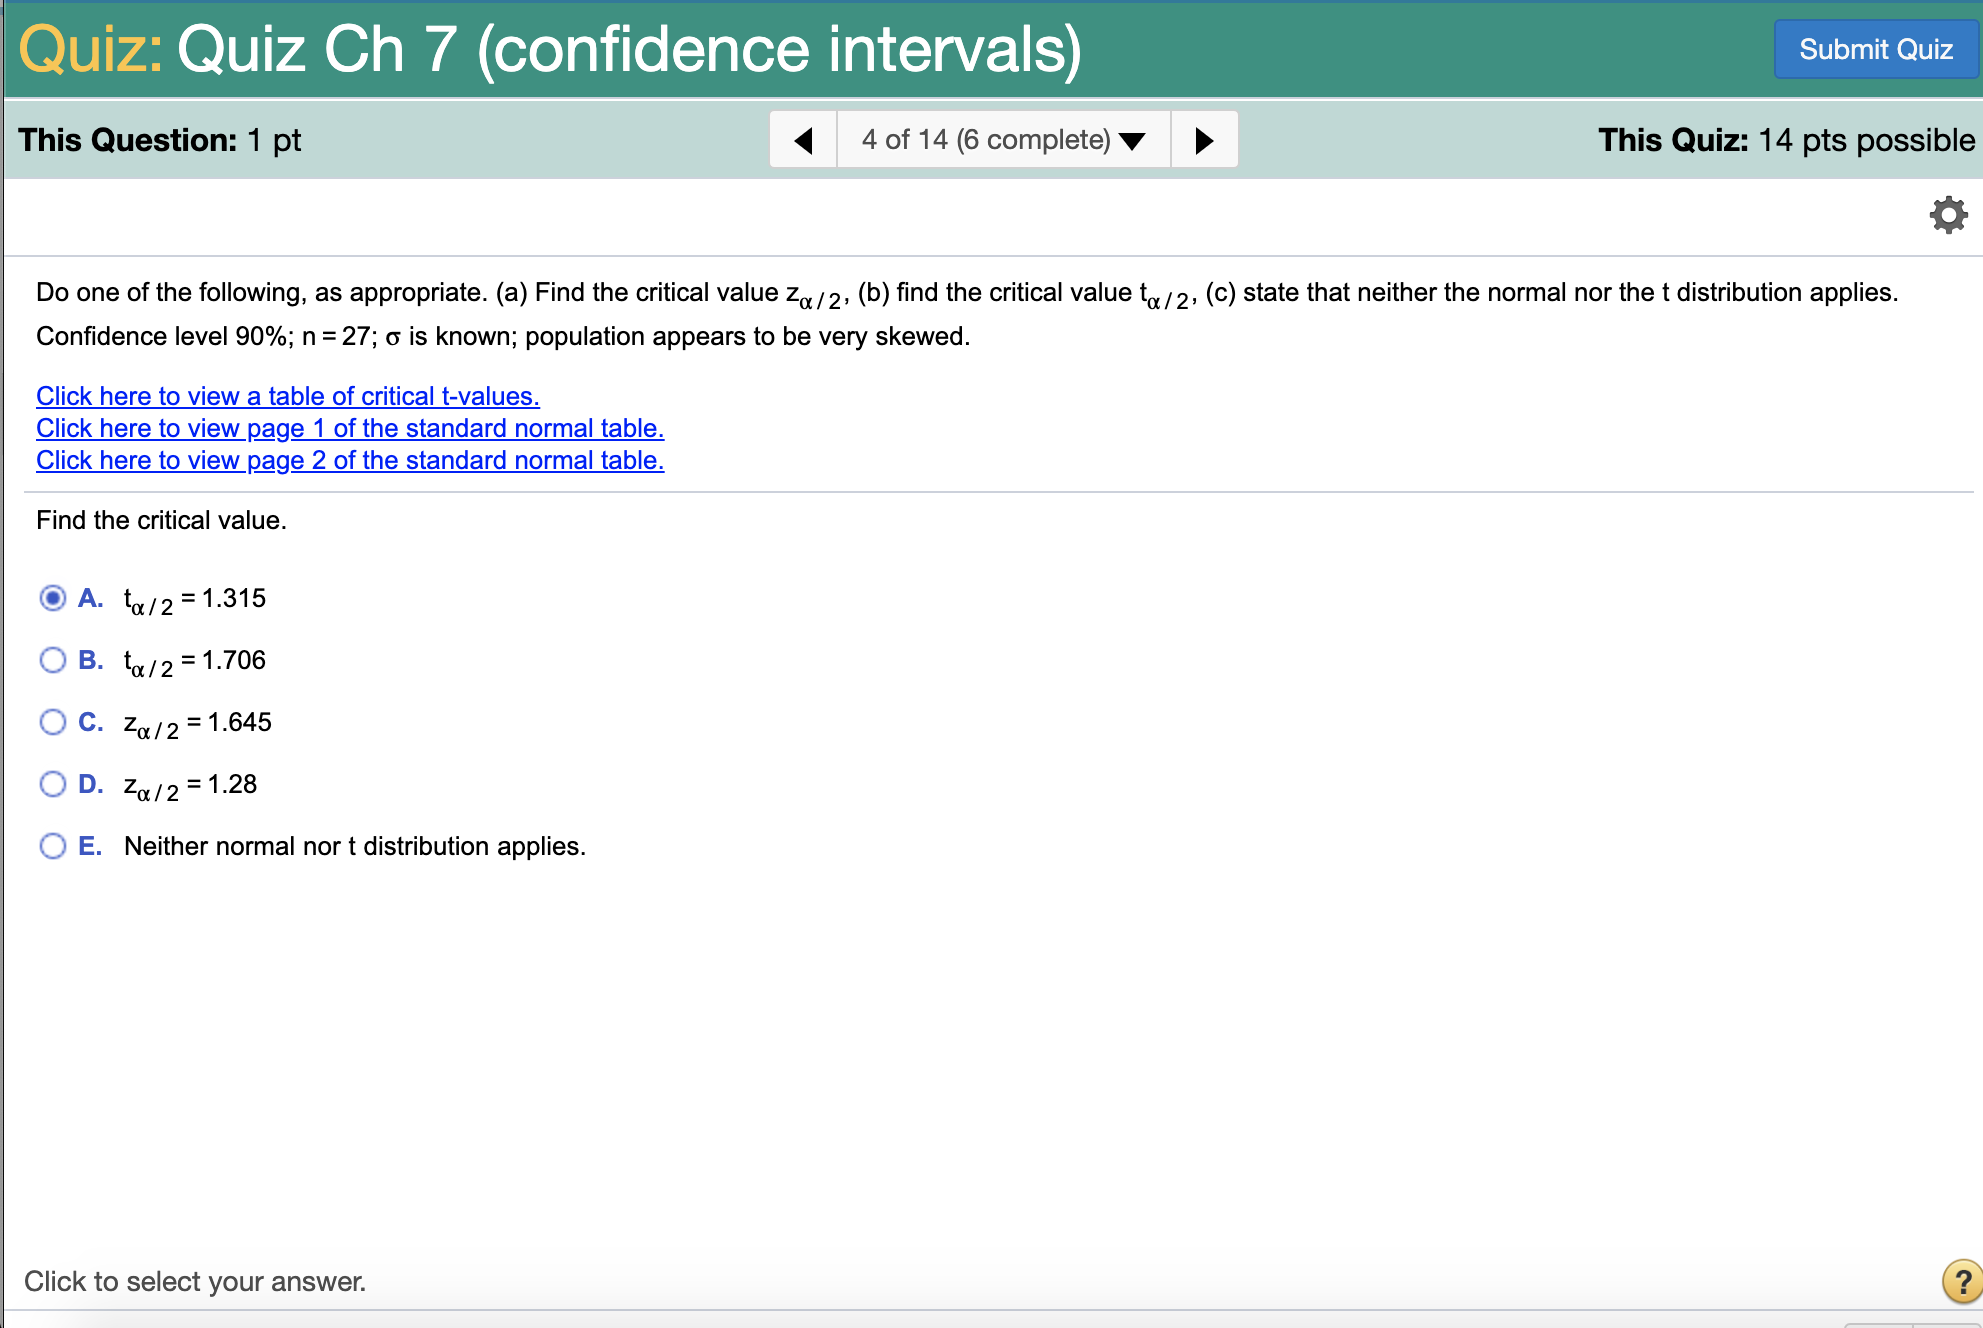
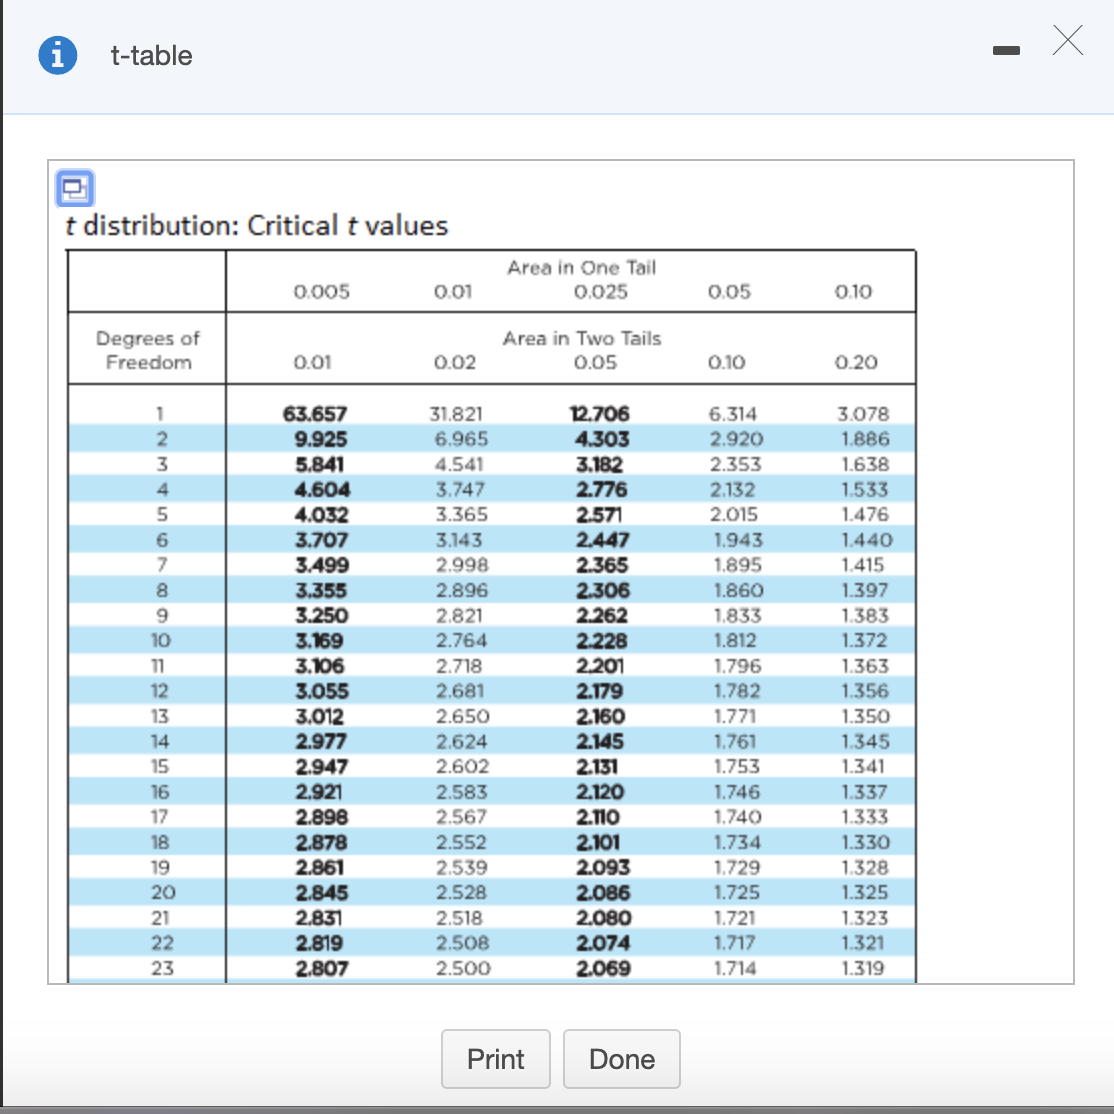
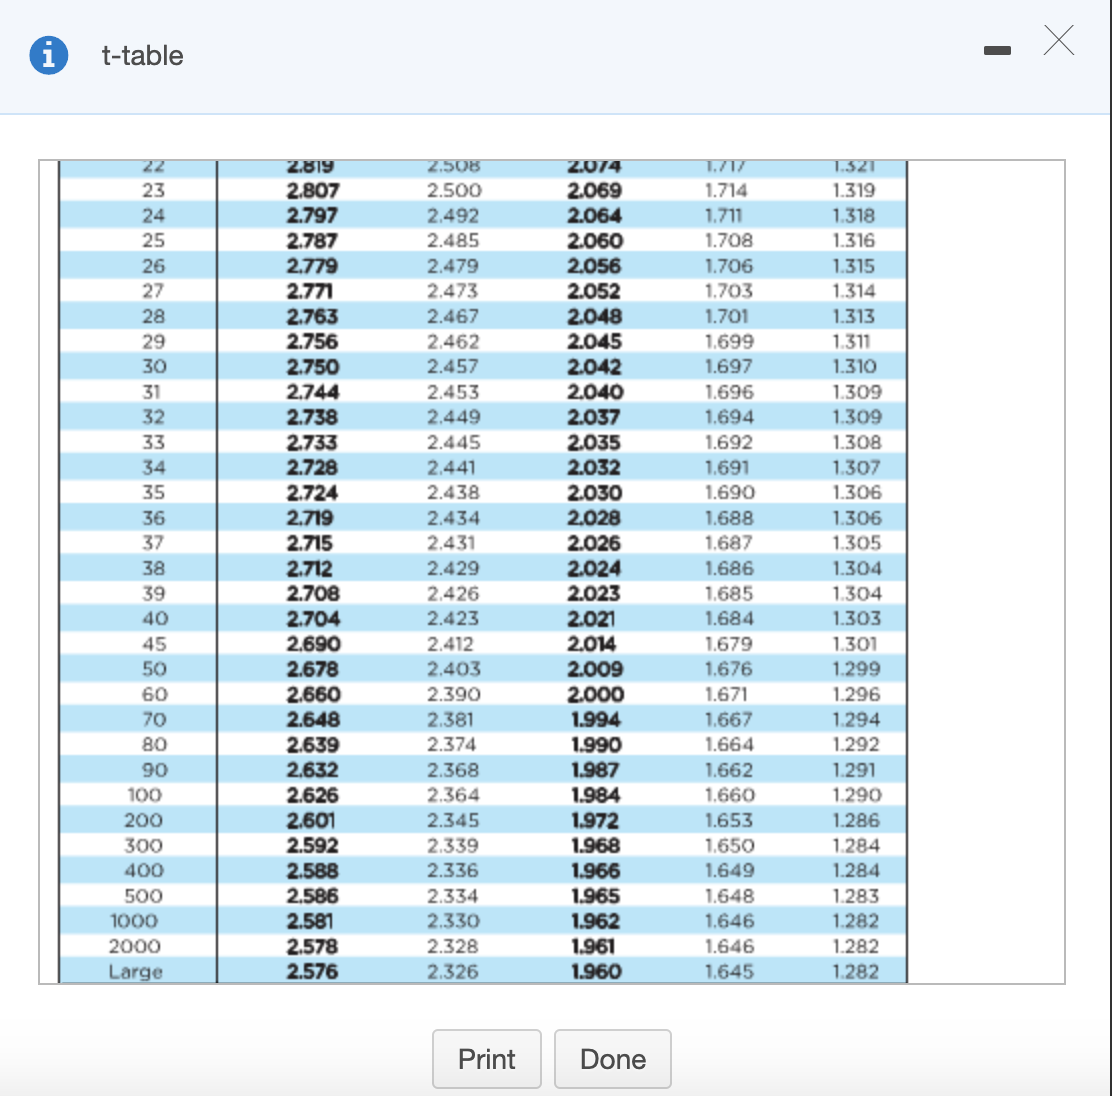
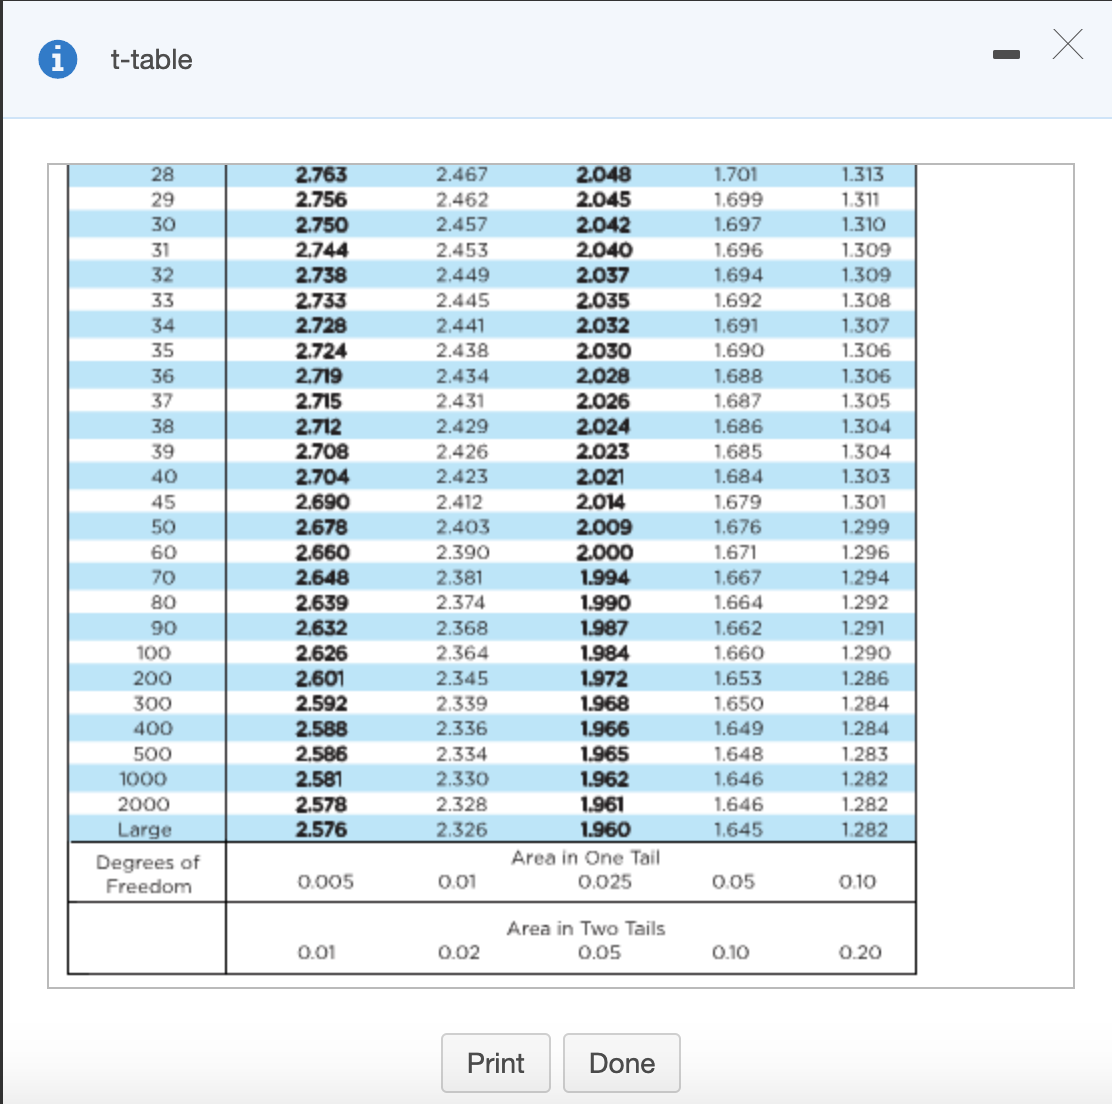
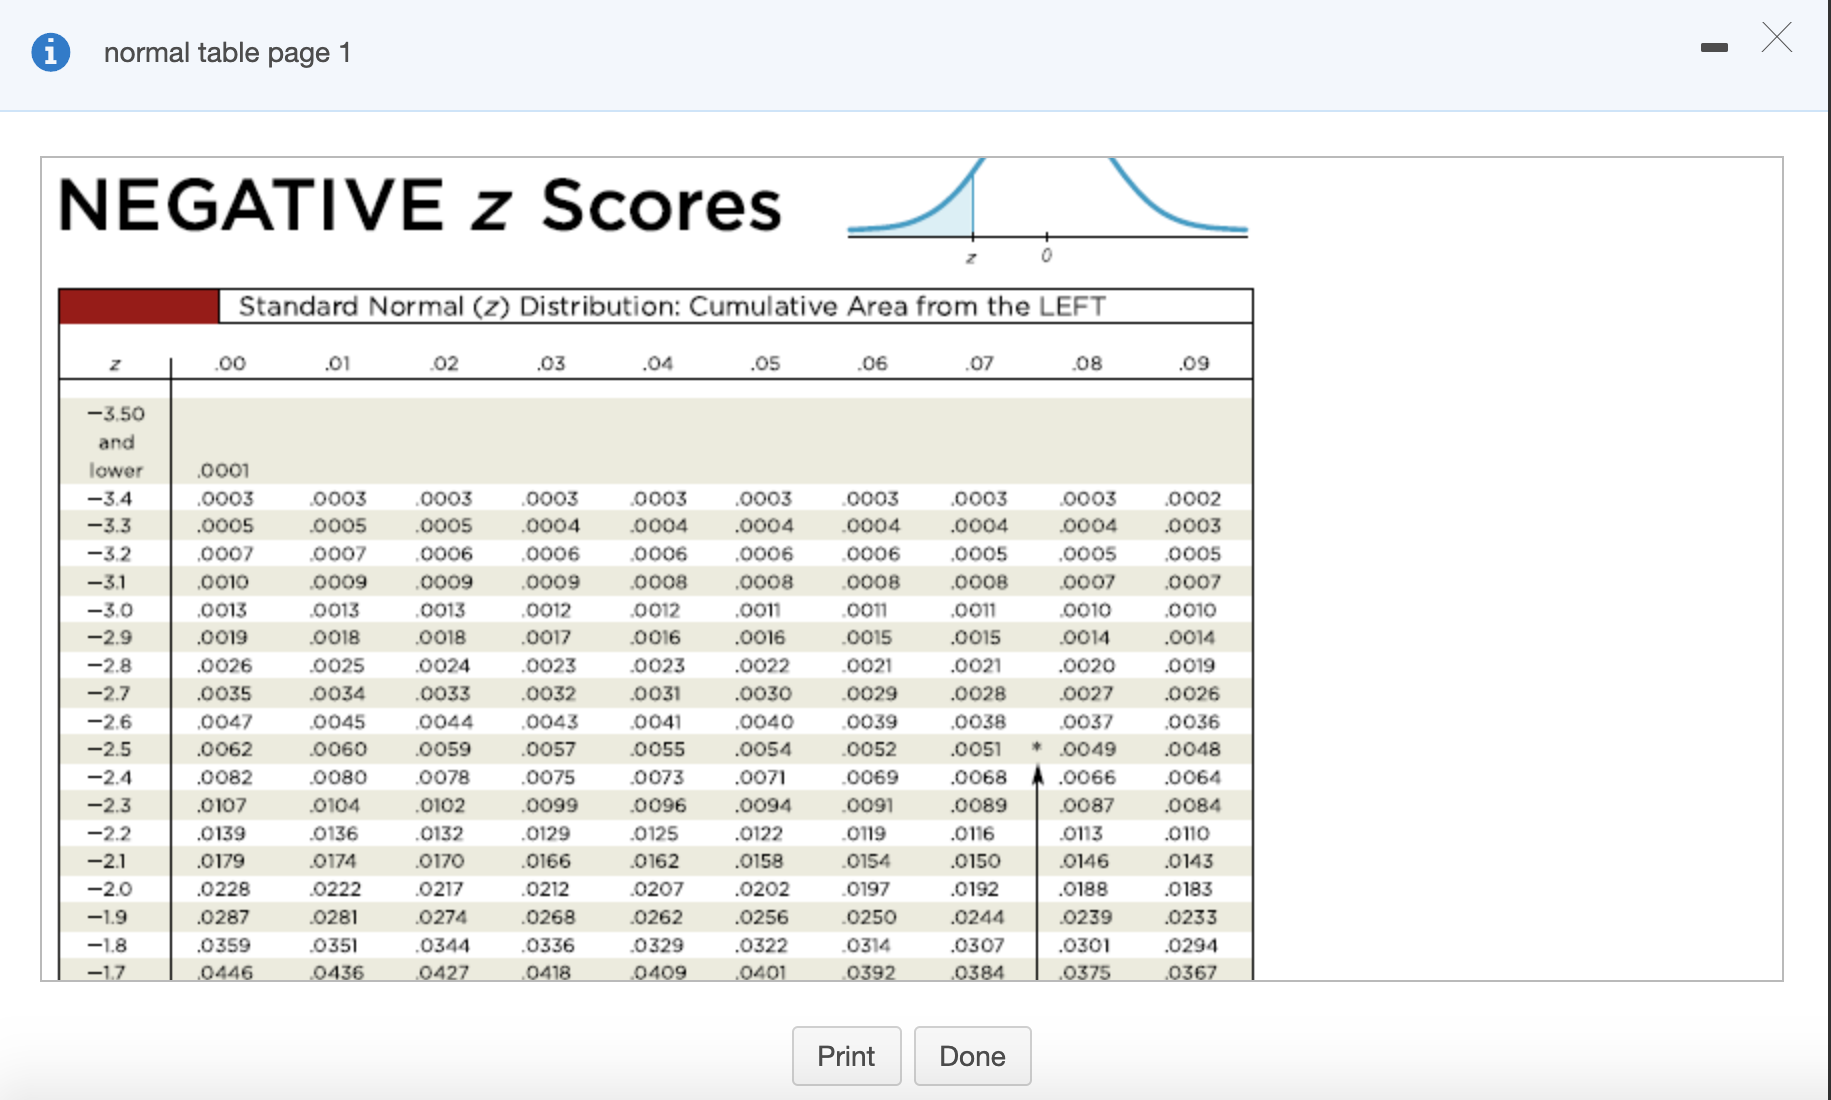
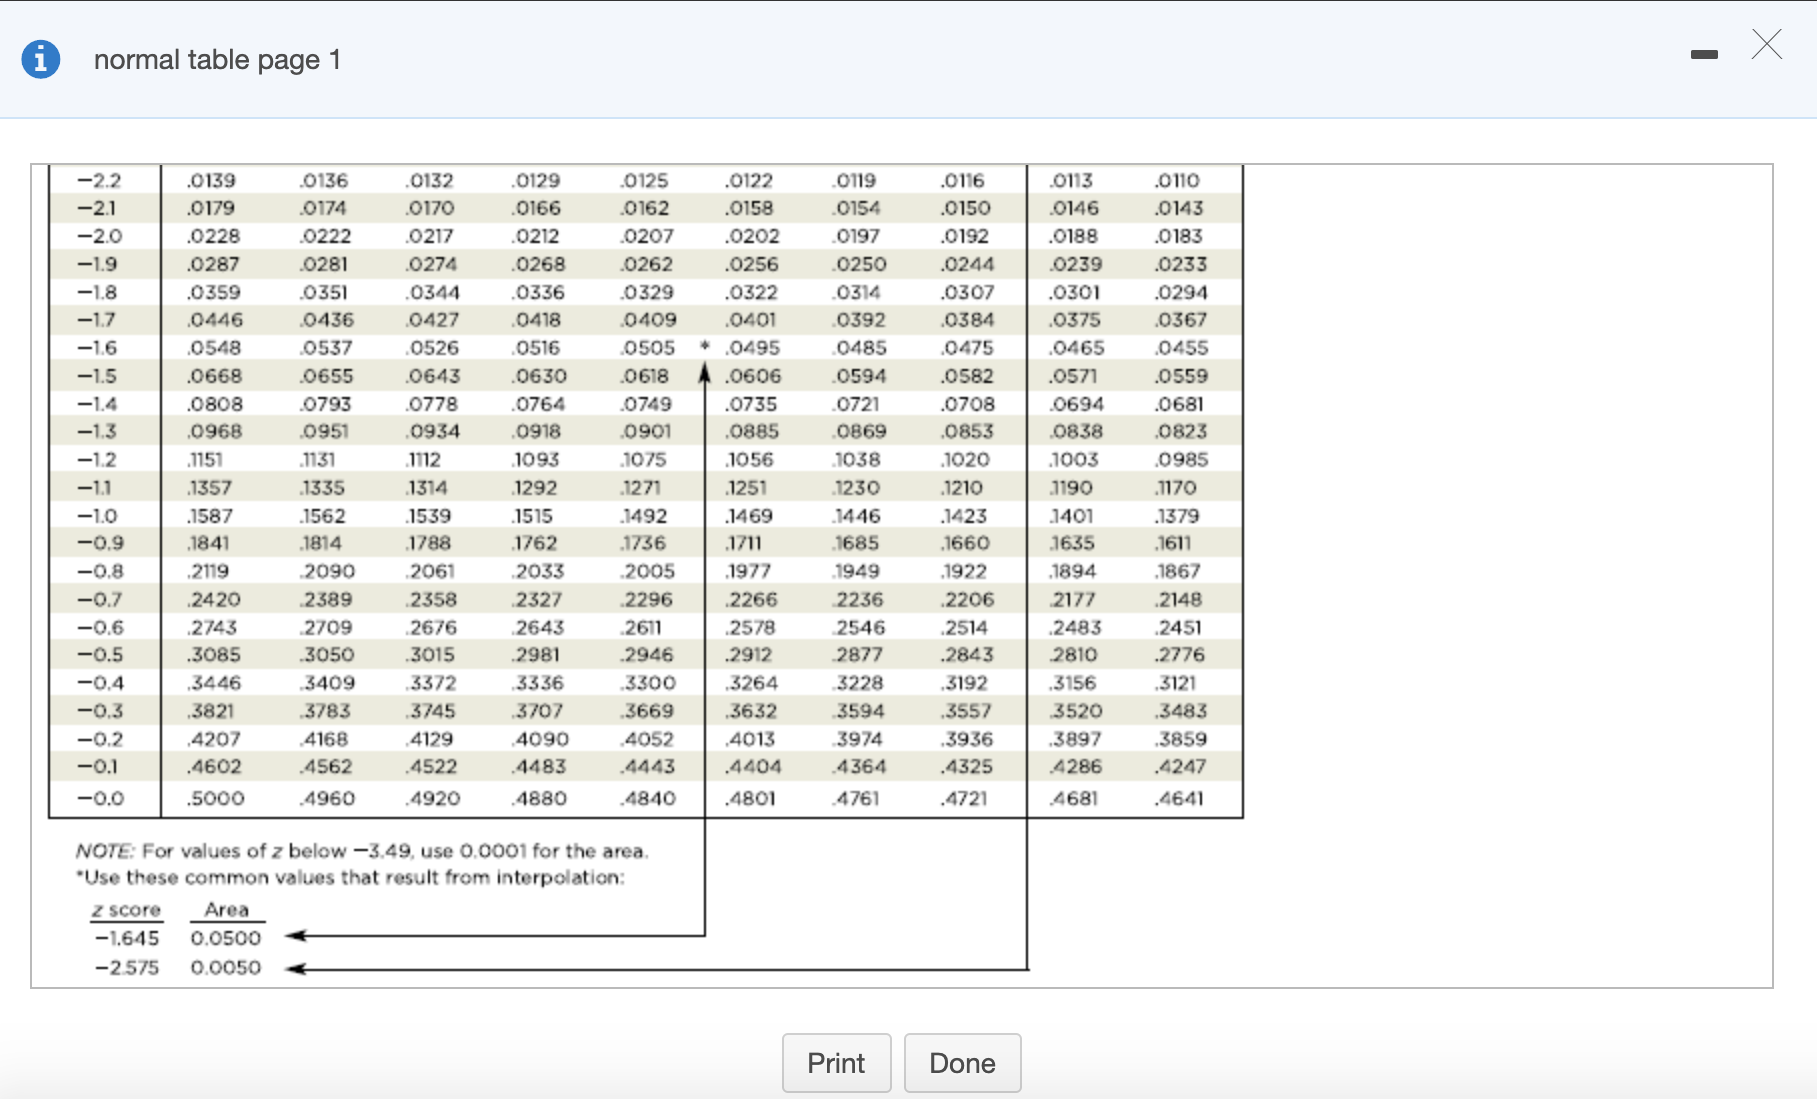
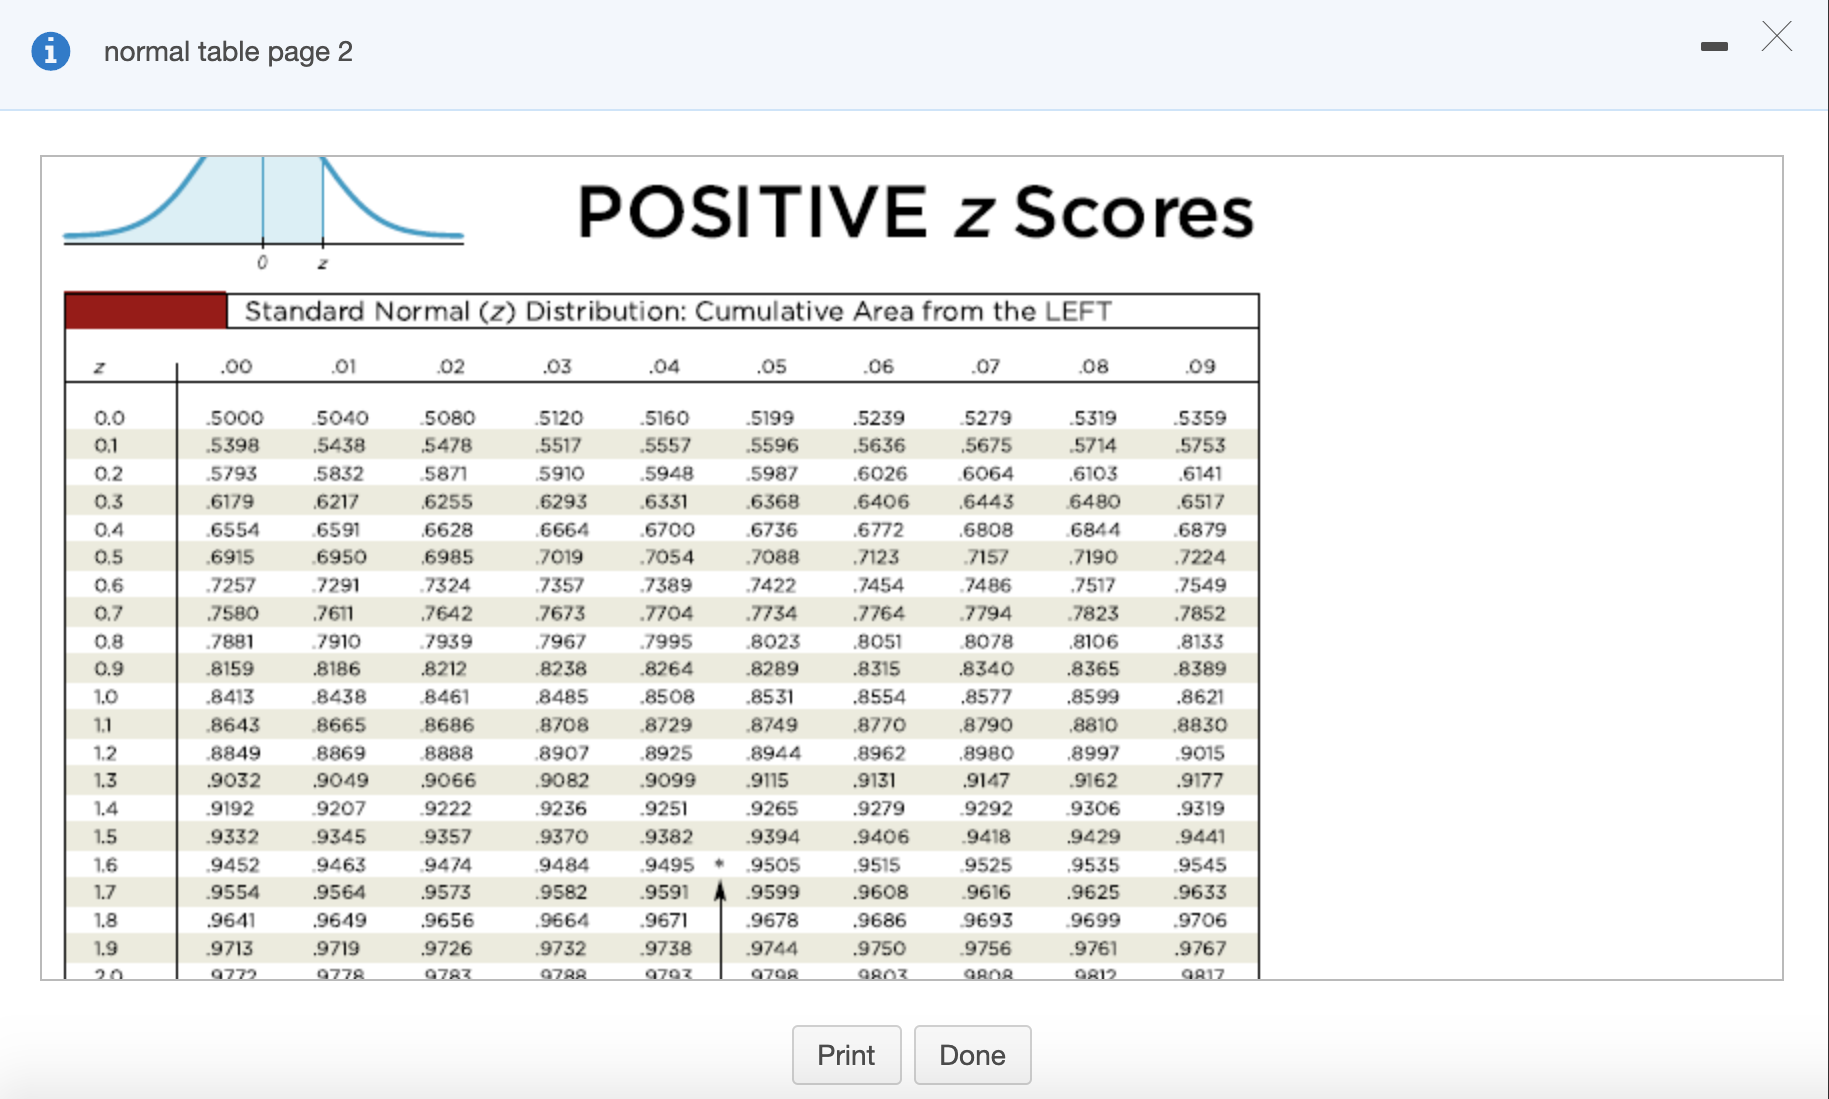
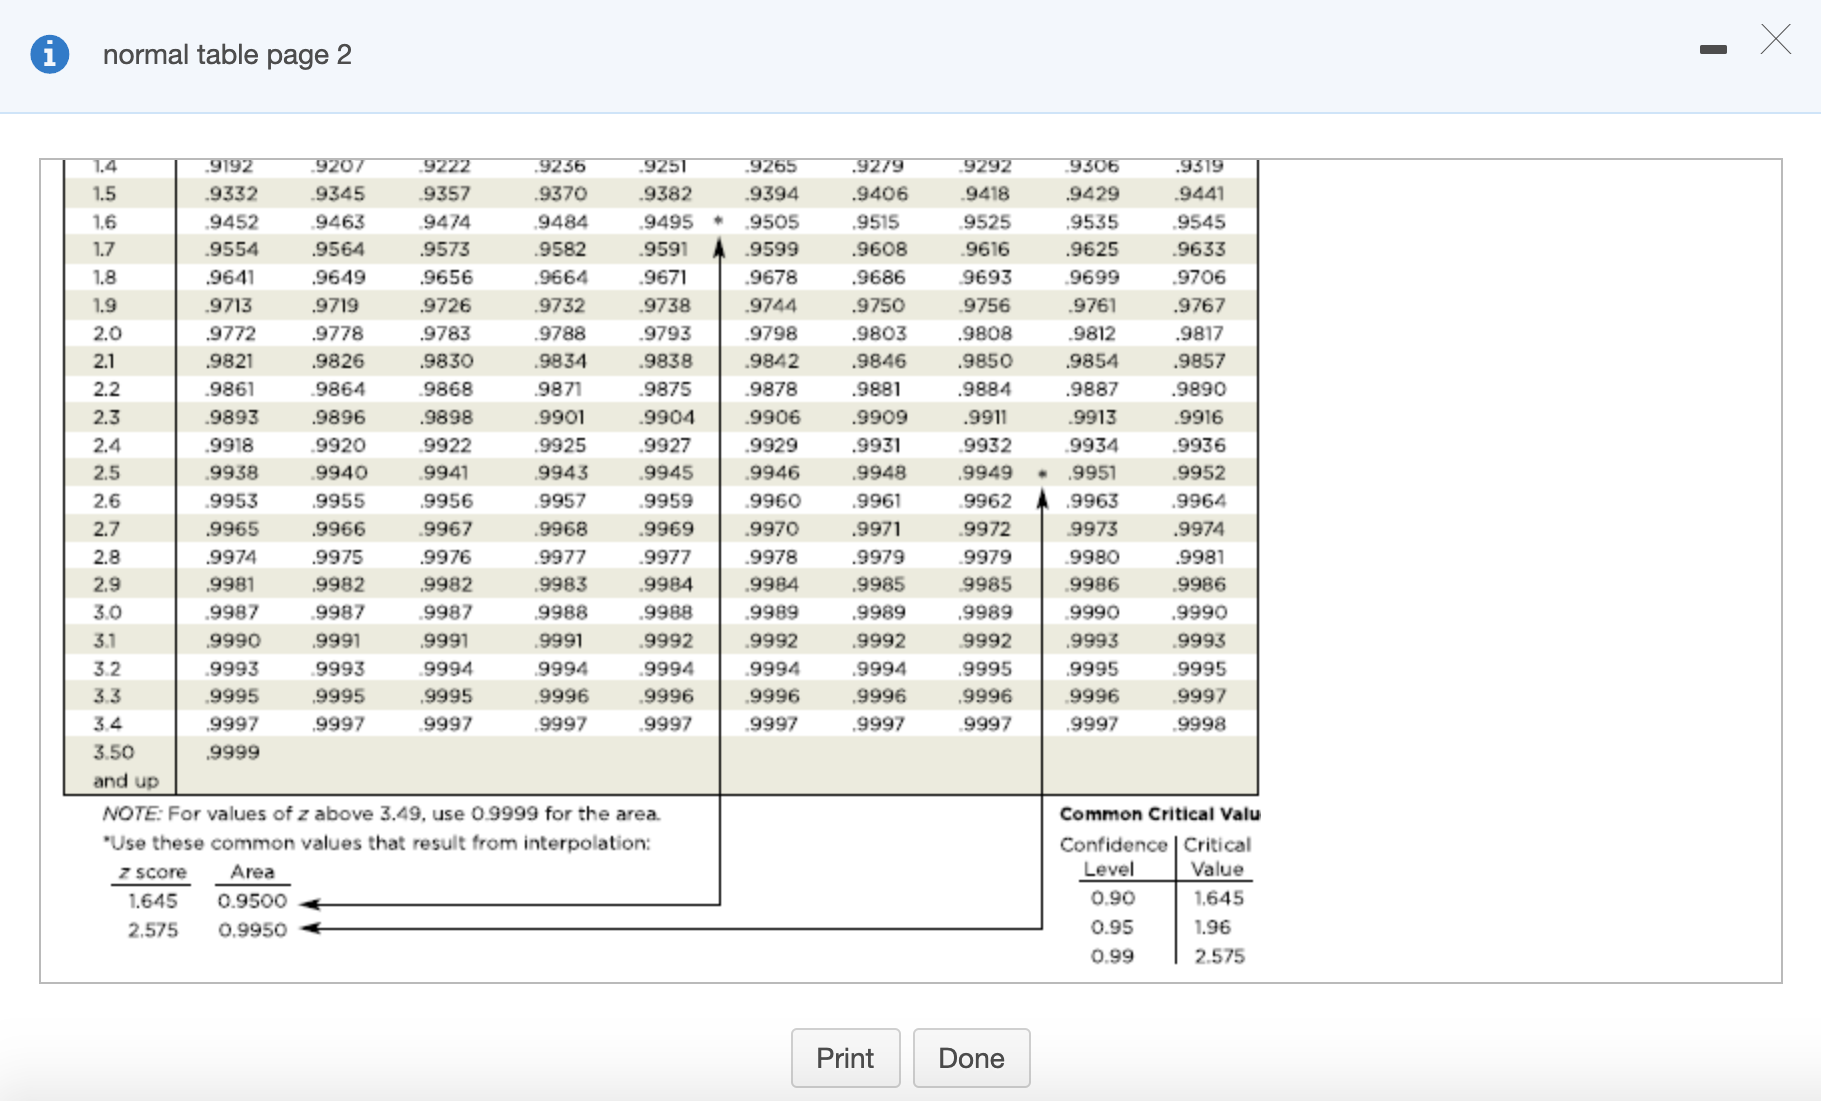
Quiz: Quiz Ch 7 (confidence intervals) Submit Quiz This Question: 1 pt 4 of 14 (6 complete) This Quiz: 14 pts possible Do one of the following, as appropriate. (a) Find the critical value Zx /2, (b) find the critical value to / 2, (c) state that neither the normal nor the t distribution applies. Confidence level 90%; n = 27; o is known; population appears to be very skewed. Click here to view a table of critical t-values. Click here to view page 1 of the standard normal table. Click here to view page 2 of the standard normal table. Find the critical value. O A. to/2 = 1.315 O B. ta/ 2 = 1.706 O C. Za/2 = 1.645 O D. Zx/2 = 1.28 O E. Neither normal nor t distribution applies. Click to select your answer. (?t distribution: Critical t values Am 111 One Tan 0.025 Wot Am in Two Tails 0.05 31.821 6. 314 3 076 - m 4.541 2.353 1.633 .- 4032 3.365 2.015 1.475 2990 1395 1415 .- 3330 2.921 1.333 1.333 1 795 3 E H E I371 l.753 1.740 1.729 \fi t-table X 28 2.763 2.467 2.048 1.701 1.313 29 2.756 2.462 2.045 1.699 1.311 30 2.750 2.457 2.042 1.697 1.310 31 2.744 2.453 2.040 1.696 1.309 32 2.738 2.449 2.037 1.694 1.309 33 2.733 2.445 2.035 1.692 1.308 34 2.728 2.441 2.032 1.691 1.307 35 2.724 2.438 2.030 1.690 1.306 36 2.719 2.434 2.028 1.688 1.306 37 2.715 2.431 2.026 1.687 1.305 38 2.712 2.429 2.024 1.686 1.304 39 2.708 2.426 2.023 1.685 1.304 40 2.704 2.423 2.021 1.684 1.303 45 2.690 2.412 2.014 1.679 1.301 50 2.678 2.403 2.009 1.676 1.299 60 2.660 2.390 2.000 1.671 1.296 70 2.648 2.38 1.994 1.667 1.294 80 2.639 2.374 1.990 1.664 1.292 90 2.632 2.368 1.987 1.662 1.291 100 2.626 2.364 1.984 1.660 1.290 200 2.601 2.345 1.972 1.653 1.286 300 2.592 2.339 1.968 1.650 1.284 400 2.588 2.336 1.966 1.649 1.284 500 2.586 2.334 1.965 1.648 1.283 1000 2.581 2.330 1.962 1.646 1.282 2000 2.578 2.328 1.961 1.646 1.282 Large 2.576 2.326 1.960 1.645 1.282 Degrees of Area in One Tail Freedom 0.005 0.01 0.025 0.05 0.10 Area in Two Tails 0.01 0.02 0.05 0.10 0.20 Print Done\fnormal table page 1 - X -2.2 .0139 .0136 .0132 0129 .0125 .0122 .0119 .0116 .0113 .0110 -2.1 .0179 0174 0170 .0166 .0162 .0158 0154 .0150 .0146 .0143 -2.0 .0228 0222 .0217 .0212 .0207 .0202 0197 .0192 .0188 .0183 -1.9 .0287 .0281 .0274 0268 .0262 .0256 .0250 .0244 .0239 .0233 -1.8 .0359 .0351 .0344 .0336 .0329 .0322 0314 .0307 0301 .0294 -1.7 .0446 0436 0427 .0418 .0409 0401 0392 .0384 .0375 .0367 -1.6 .0548 .0537 .0526 0516 0505 .0495 0485 0475 0465 0455 -1.5 .0668 .0655 .0643 .0630 .0618 .0606 0594 .0582 .0571 .0559 -1.4 .0808 .0793 .0778 0764 .0749 0735 0721 .0708 0694 .0681 -1.3 0968 0951 0934 .0918 0901 0885 0869 0853 0838 .0823 -1.2 .1151 .1131 1112 .1093 .1075 .1056 1038 .1020 .1003 .0985 -1.1 .1357 .1335 1314 .1292 .1271 1251 .1230 .1210 .1190 .1170 -1.0 .1587 1562 1539 .1515 .1492 .1469 .1446 .1423 1401 .1379 -0.9 1841 1814 1788 1762 .1736 1711 1685 1660 1635 1611 -0.8 2119 2090 2061 .2033 .2005 1977 .1949 .1922 1894 .1867 -0.7 .2420 .2389 2358 2327 .2296 .2266 2236 .2206 2177 .2148 -0.6 .2743 .2709 .2676 .2643 .2611 .2578 2546 .2514 .2483 .2451 -0.5 .3085 .3050 3015 .2981 .2946 .2912 .2877 .2843 2810 .2776 -0.4 3446 3409 3372 3336 .3300 .3264 3228 .3192 3156 .3121 -0.3 ,3821 .3783 3745 3707 .3669 .3632 3594 3557 3520 .3483 -0.2 4207 4168 4129 4090 4052 4013 3974 3936 3897 3859 -0.1 .4602 4562 4522 4483 4443 4404 4364 .4325 4286 .4247 -0.0 .5000 .4960 .4920 4880 .4840 .4801 4761 .4721 4681 .4641 NOTE: For values of z below -3.49, use 0.0001 for the area. "Use these common values that result from interpolation: z score Area -1.645 0.0500 -2.575 0.0050 Print Donenormal table page 2 - X POSITIVE z Scores Standard Normal (z) Distribution: Cumulative Area from the LEFT Z .00 .01 .02 .03 .04 .05 .06 .07 .08 .09 0.0 5000 5040 5080 .5120 .5160 .5199 .5239 5279 .5319 5359 0,1 .5398 .5438 .5478 5517 .5557 .5596 .5636 .5675 .5714 5753 0.2 5793 .5832 5871 5910 5948 5987 6026 6064 .6103 .6141 0.3 6179 6217 6255 6293 6331 6368 .6406 6443 6480 6517 0.4 .6554 659 .6628 6664 6700 6736 6772 .6808 .6844 6879 0.5 .6915 6950 .6985 .7019 7054 .7088 .7123 7157 .7190 .7224 0.6 .7257 7291 .7324 .7357 .7389 .7422 .7454 .7486 .7517 ,7549 0.7 .7580 7611 .7642 .7673 7704 .7734 .7764 7794 7823 .7852 0.8 .7881 7910 7939 7967 .7995 .8023 8051 8078 .8106 .8133 0.9 .8159 .8186 .8212 8238 8264 .8289 .8315 8340 8365 8389 1.0 8413 8438 8461 .8485 .8508 .8531 .8554 .8577 .8599 .8621 1.1 .8643 8665 8686 8708 8729 8749 8770 8790 8810 8830 1.2 .8849 8869 8888 8907 8925 8944 .8962 8980 8997 9015 1.3 .9032 9049 .9066 9082 .9099 .9115 .9131 .9147 9162 .9177 1.4 9192 9207 .9222 9236 9251 .9265 .9279 9292 9306 .9319 1.5 9332 9345 9357 9370 9382 .9394 .9406 9418 .9429 9441 1.6 9452 9463 9474 9484 9495 .9505 .9515 9525 9535 9545 1.7 9554 .9564 .9573 9582 9591 .9599 .9608 9616 .9625 9633 1.8 .9641 .9649 9656 9664 9671 9678 .9686 9693 .9699 .9706 1.9 9713 9719 .9726 9732 9738 9744 .9750 9756 9761 .9767 9772 9778 9787 0788 9707 9708 9807 0812 9817 Print Donei normal table page 2 X 1.4 .9192 9207 9222 .9236 .9251 .9265 .9279 .9292 9306 .9319 1.5 .9332 9345 9357 9370 .9382 9394 .9406 9418 .9429 9441 1.6 9452 9463 9474 9484 9495 9505 .9515 9525 .9535 .9545 1.7 9554 .9564 .9573 9582 .9591 .9599 .9608 9616 .9625 9633 1.8 .9641 .9649 .9656 .9664 9671 9678 .9686 9693 .9699 9706 1.9 9713 9719 .9726 9732 9738 9744 .9750 9756 9761 9767 2.0 9772 .9778 .9783 9788 .9793 9798 .9803 .9808 .9812 .9817 2.1 .9821 9826 .9830 .9834 9838 9842 .9846 9850 .9854 9857 2.2 9861 9864 9868 9871 .9875 .9878 .9881 9884 .9887 9890 2.3 9893 .9896 .9898 9901 9904 .9906 .9909 9911 9913 9916 2.4 9918 9920 9922 9925 .9927 9929 .9931 9932 .9934 9936 2.5 9938 9940 9941 .9943 .9945 9946 .9948 9949 .9951 9952 2.6 9953 9955 9956 9957 .9959 9960 9961 9962 .9963 9964 2.7 .9965 9966 .9967 .9968 9969 9970 9971 9972 9973 9974 2.8 9974 9975 .9976 9977 9977 9978 .9979 9979 9980 .9981 2.9 9981 9982 .9982 .9983 .9984 9984 .9985 9985 9986 9986 3.0 9987 9987 9987 9988 9988 .9989 .9989 9989 .9990 9990 3.1 .9990 9991 .9991 9991 9992 .9992 .9992 9992 .9993 9993 3.2 .9993 9993 9994 9994 9994 .9994 .9994 9995 .9995 .9995 3.3 9995 9995 9995 9996 9996 9996 9996 9996 9996 9997 3.4 9997 9997 9997 .9997 9997 .9997 .9997 .9997 .9997 9998 3.50 .9999 and up NOTE: For values of z above 3.49, use 0.9999 for the area. Common Critical Valu Use these common values that result from interpolation: Confidence | Critical z score Area Level Value 1.645 0.9500 0.90 1.645 2.575 0.9950 0.95 1.96 0.99 2.575 Print Done