Answered step by step
Verified Expert Solution
Question
1 Approved Answer
May you help me solve the Ending Finished Goods Inventory Budget, COGS.Cash Budget, Income Statement, and Balance Sheet? *****The Check figures ( to make sure
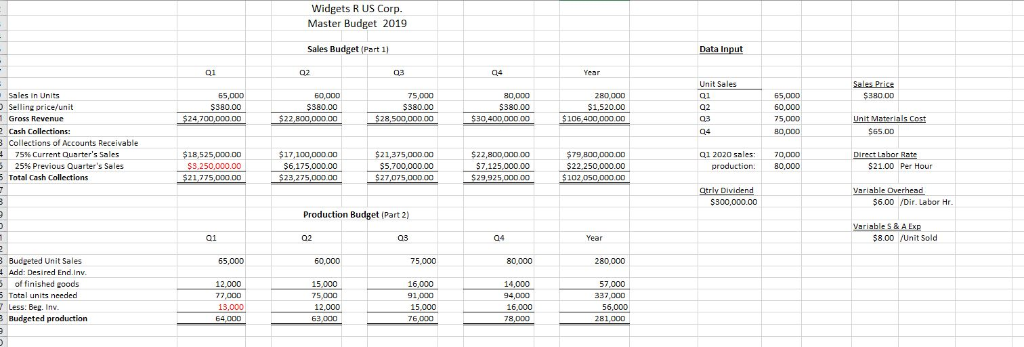
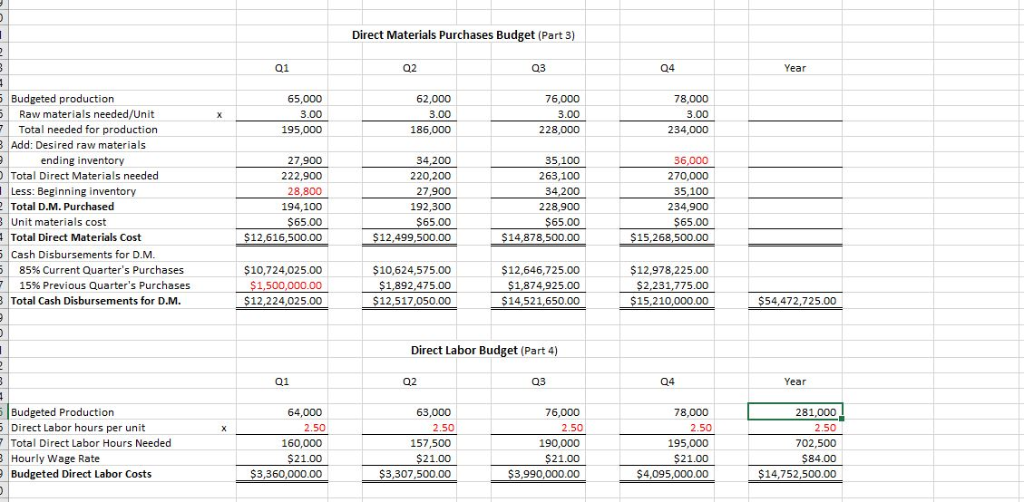
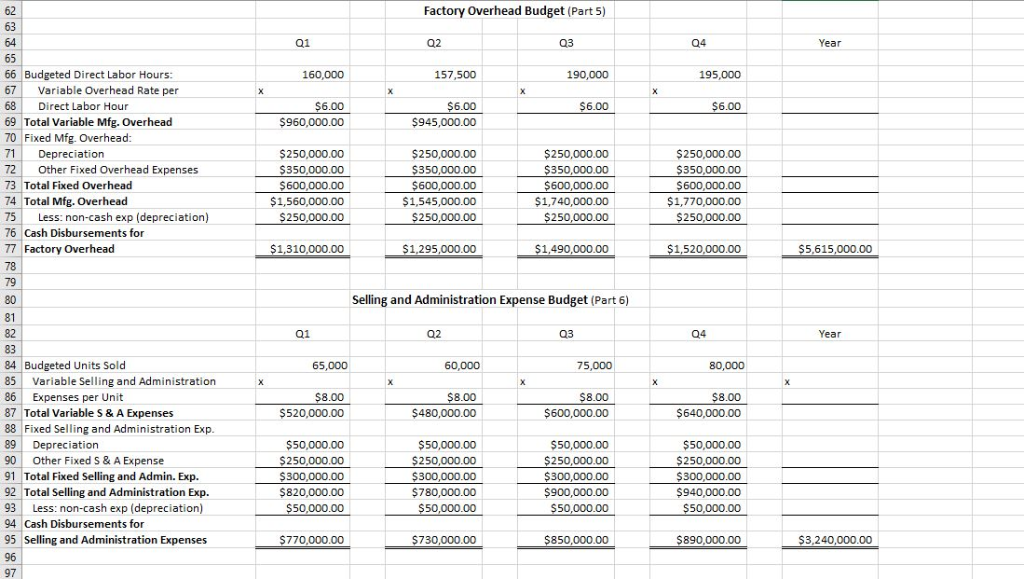
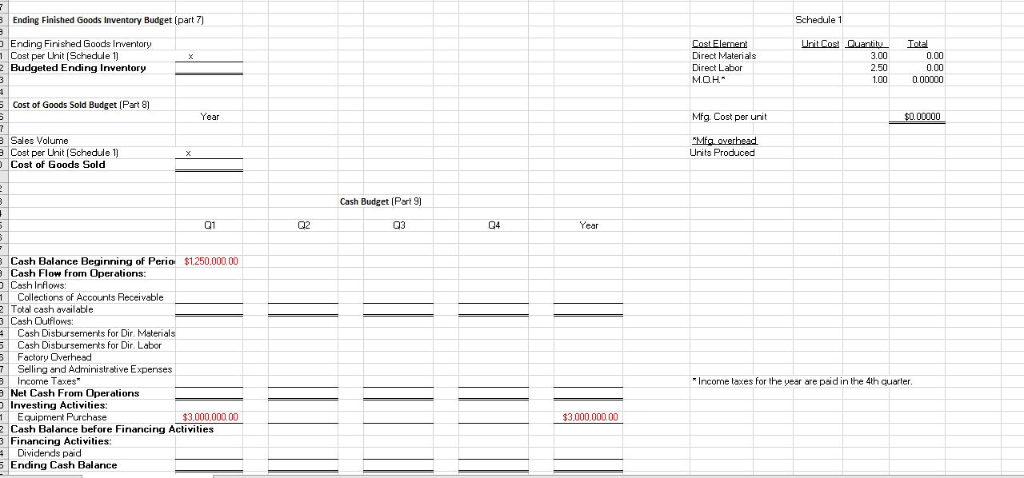
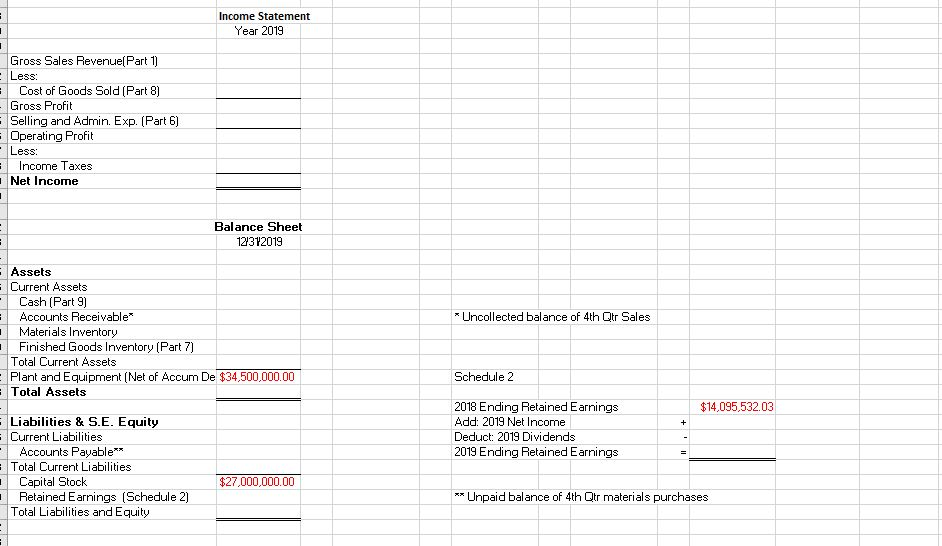

May you help me solve the Ending Finished Goods Inventory Budget, COGS.Cash Budget, Income Statement, and Balance Sheet?
*****The Check figures ( to make sure it's right) that were given is Budgeted Ending Inventory is $3794572.95, COGS is $75891459.07, and Ending Cash Balance is 11545785.68. ******
Widgets R US Corp. Master Budget 2019 Sales Budget (Part 11 Data Input 03 9 Year Unit Sales Sale Price $380.00 55,000 $380.00 $24.700,000.00 60,000 $380.00 $22,800,000 00 75.000 $380.00 $28,500,000.00 80,000 $380.00 $30,400,000 00 280,000 $1,520.00 $106 400,000.00 02 Sales in Units Selling price/unit Gross Revenue 2 Cash Collections: 3 Collections of Accounts Receivable # 75% Current Quarter's Sales 5 25% Previous Quarter's Sales 5 Total Cash Collections 65,000 60.000 75,000 80,000 Unit Materials Cost $65.00 $18,525,000.00 S3.250,000.00 $21,775,000.00 $17,100,000.00 $6,175,000.00 $23,275,000.00 $21,375,000.00 $5,700,000.00 $ 27,075,000.00 $22,800,000.00 $7,125,000.00 $ 29,925,000.00 $ 79,800,000.00 $22,250,000.00 $102,050,000.00 Q1 2020 sales: production: 70,000 80,000 Direct Labor Rate $21.00 Per Hour Otrly Dividend $300,000.00 Variable Overhead $6.00 /Dir. Labor Hr. Production Budget (Part 2) 04 Variable S & A Exp $8.00 /Unit Sold Year 65,000 60,000 75,000 80,000 280,000 16,000 3 Budgeted Unit Sales # Add: Desired End.Inv. 5 of finished goods 5 Total units needed Less. Beg. Inv. 3 Budgeted production 12.000 77,000 19.000 15,000 75 000 12.000 91.000 14,000 94.000 16.000 78,000 57.000 337.000 56,000 281 000 15.000 Direct Materials Purchases Budget (Part 3) Q1 Q2 Q3 Q4 Year 65,000 3.00 195,000 62,000 3.00 186,000 76,000 3.00 228,000 78,000 3.00 234,000 5 Budgeted production 5 Raw materials needed/Unit - Total needed for production B Add: Desired raw materials ending inventory Total Direct Materials needed Less: Beginning inventory 2 Total D.M. Purchased 3 Unit materials cost Total Direct Materials Cost 5 Cash Disbursements for D.M. 85% Current Quarter's Purchases 7 15% Previous Quarter's Purchases 3 Total Cash Disbursements for D.M. 27,900 222,900 28,800 194,100 $65.00 $12,616,500.00 34,200 220,200 27,900 192,300 $65.00 $12,499,500.00 35,100 263,100 34,200 228,900 $65.00 $14,878,500.00 36,000 270,000 35,100 234,900 $65.00 $15,268,500.00 $10,724,025.00 $1,500,000.00 $12,224,025.00 $10,624,575.00 $1,892,475.00 $12,517,050.00 $12,646,725.00 $1,874,925.00 $14,521,650.00 $12,978,225.00 $2,231,775.00 $15,210,000.00 $54,472,725.00 Direct Labor Budget (Part 4) Q2 Q3 Q4 Year 5 Budgeted Production 5 Direct Labor hours per unit 7 Total Direct Labor Hours Needed 3 Hourly Wage Rate Budgeted Direct Labor Costs 64,000 2.50 160,000 $ 21.00 $3,360,000.00 63,000 2.50 157,500 $21.00 $3,307,500.00 76,000 2.50 190,000 $21.00 $3,990,000.00 78,000 2.50 195,000 $21.00 $4,095,000.00 281,000! 2.50 702,500 $84.00 $14,752,500.00 Factory Overhead Budget (Part 5) BOS Q1 Q2 Q3 Year 160,000 157,500 190,000 195,000 $6.00 $6.00 $6.00 $960,000.00 $6.00 $945,000.00 65 66 Budgeted Direct Labor Hours: 67 Variable Overhead Rate per 68 Direct Labor Hour 69 Total Variable Mfg. Overhead 70 Fixed Mfg. Overhead: 71 Depreciation 72 Other Fixed Overhead Expenses 73 Total Fixed Overhead 74 Total Mfg. Overhead 75 Less: non-cash exp (depreciation) 76 Cash Disbursements for 77 Factory Overhead $250,000.00 $350,000.00 $600,000.00 $1,560,000.00 $250,000.00 $250,000.00 $350,000.00 $600,000.00 $1,545,000.00 $250,000.00 $250,000.00 $350,000.00 $600,000.00 $1,740,000.00 $250,000.00 $250,000.00 $350,000.00 $600,000.00 $1,770,000.00 $250,000.00 $1,310,000.00 $1,295,000.00 $1,490,000.00 $1,520,000.00 $5,615,000.00 Selling and Administration Expense Budget (Part 6) Q1 02 Q3 04 Year 65,000 60,000 75,000 80,000 $8.00 $520,000.00 $8.00 $480,000.00 $8.00 $600,000.00 $8.00 $640,000.00 84 Budgeted Units Sold 85 Variable Selling and Administration 86 Expenses per Unit 87 Total Variable S & A Expenses 88 Fixed Selling and Administration Exp. 89 Depreciation 90 Other Fixed S & A Expense 91 Total Fixed Selling and Admin. Exp. 92 Total Selling and Administration Exp. 93 Less: non-cash exp (depreciation) 94 Cash Disbursements for 95 Selling and Administration Expenses 96 $50,000.00 $250,000.00 $300,000.00 $820,000.00 $50,000.00 $50,000.00 $250,000.00 $300,000.00 $780,000.00 $50,000.00 $50,000.00 $250,000.00 $300,000.00 $900,000.00 $50,000.00 $50,000.00 $250,000.00 $300,000.00 $940,000.00 $50,000.00 $770,000.00 $ 730,000.00 $850,000.00 $890,000.00 $3,240,000.00 3 Ending Finished Goods Inventory Budget (part 7) Schedule 1 Ending Finished Goods Inventory 1 Cost per Unit (Schedule 1) 2 Budgeted Ending Inventory Cost Element Direct Materials Direct Labor MOH Unit Cost Duantity Total 3.000 .00 2.50 0.00 1.00 0.00000 U UI Cost of Goods Sold Budget (Part 8) Year Mfg. Cost per unit $0.00000 3 Sales Volume Cost per Unit (Schedule 1) Cost of Goods Sold Mta overhead Units Produced Cash Budget (Part 2) Cash Balance Beginning of Perio $1.250.000.00 e Cash Flow from Operations: Cosh Inflows: 1 Collections of Accounts Receivable 2 Total cash available 3 Cosh Outflows: - Cash Disbursements for Dir. Materials 5 Cash Disbursements for Dir. Labor 3 Factory Overhead 7 Selling and Administrative Expenses B Income Taxes Net Cash From Operations Investing Activities: 1 Equipment Purchase $3.000.000.00 2 Cash Balance before Financing Activities 3 Financing Activities: - Dividends paid 5 Ending Cash Balance * Income laxes for the year are paid in the 4th quarter. $3.000.000.00 Income Statement Year 2019 Gross Sales Revenue(Part 1) Less: - Cost of Goods Sold (Part 8) - Gross Profit Selling and Admin. Exp. (Part 6) - Operating Profit - Less: - Income Taxes Net Income Balance Sheet 12/312019 Uncollected balance of 4th Qtr Sales Assets - Current Assets - Cash (Part 9) - Accounts Receivable 1 Materials Inventory Finished Goods Inventory (Part 7) Total Current Assets Plant and Equipment (Net of Accum De $34,500,000.00 - Total Assets Schedule 2 $14,095,532.03 2018 Ending Retained Earnings Add: 2019 Net Income Deduct: 2019 Dividends 2019 Ending Retained Earnings - Liabilities & S.E. Equity - Current Liabilities - Accounts Payable** - Total Current Liabilities Capital Stock 1 Retained Earnings (Schedule 2) Total Liabilities and Equity $27,000,000.00 ** Unpaid balance of 4th Qtr materials purchases Income Statement Year 2019 Gross Sales Revenue(Part 1) Less: - Cost of Goods Sold (Part 8) - Gross Profit Selling and Admin. Exp. (Part 6) - Operating Profit - Less: - Income Taxes Net Income Balance Sheet 12/312019 Uncollected balance of 4th Qtr Sales Assets - Current Assets - Cash (Part 9) - Accounts Receivable 1 Materials Inventory Finished Goods Inventory (Part 7) Total Current Assets Plant and Equipment (Net of Accum De $34,500,000.00 - Total Assets Schedule 2 $14,095,532.03 2018 Ending Retained Earnings Add: 2019 Net Income Deduct: 2019 Dividends 2019 Ending Retained Earnings - Liabilities & S.E. Equity - Current Liabilities - Accounts Payable** - Total Current Liabilities Capital Stock 1 Retained Earnings (Schedule 2) Total Liabilities and Equity $27,000,000.00 ** Unpaid balance of 4th Qtr materials purchasesStep by Step Solution
There are 3 Steps involved in it
Step: 1

Get Instant Access to Expert-Tailored Solutions
See step-by-step solutions with expert insights and AI powered tools for academic success
Step: 2

Step: 3
Ace Your Homework with AI
Get the answers you need in no time with our AI-driven, step-by-step assistance
Get Started