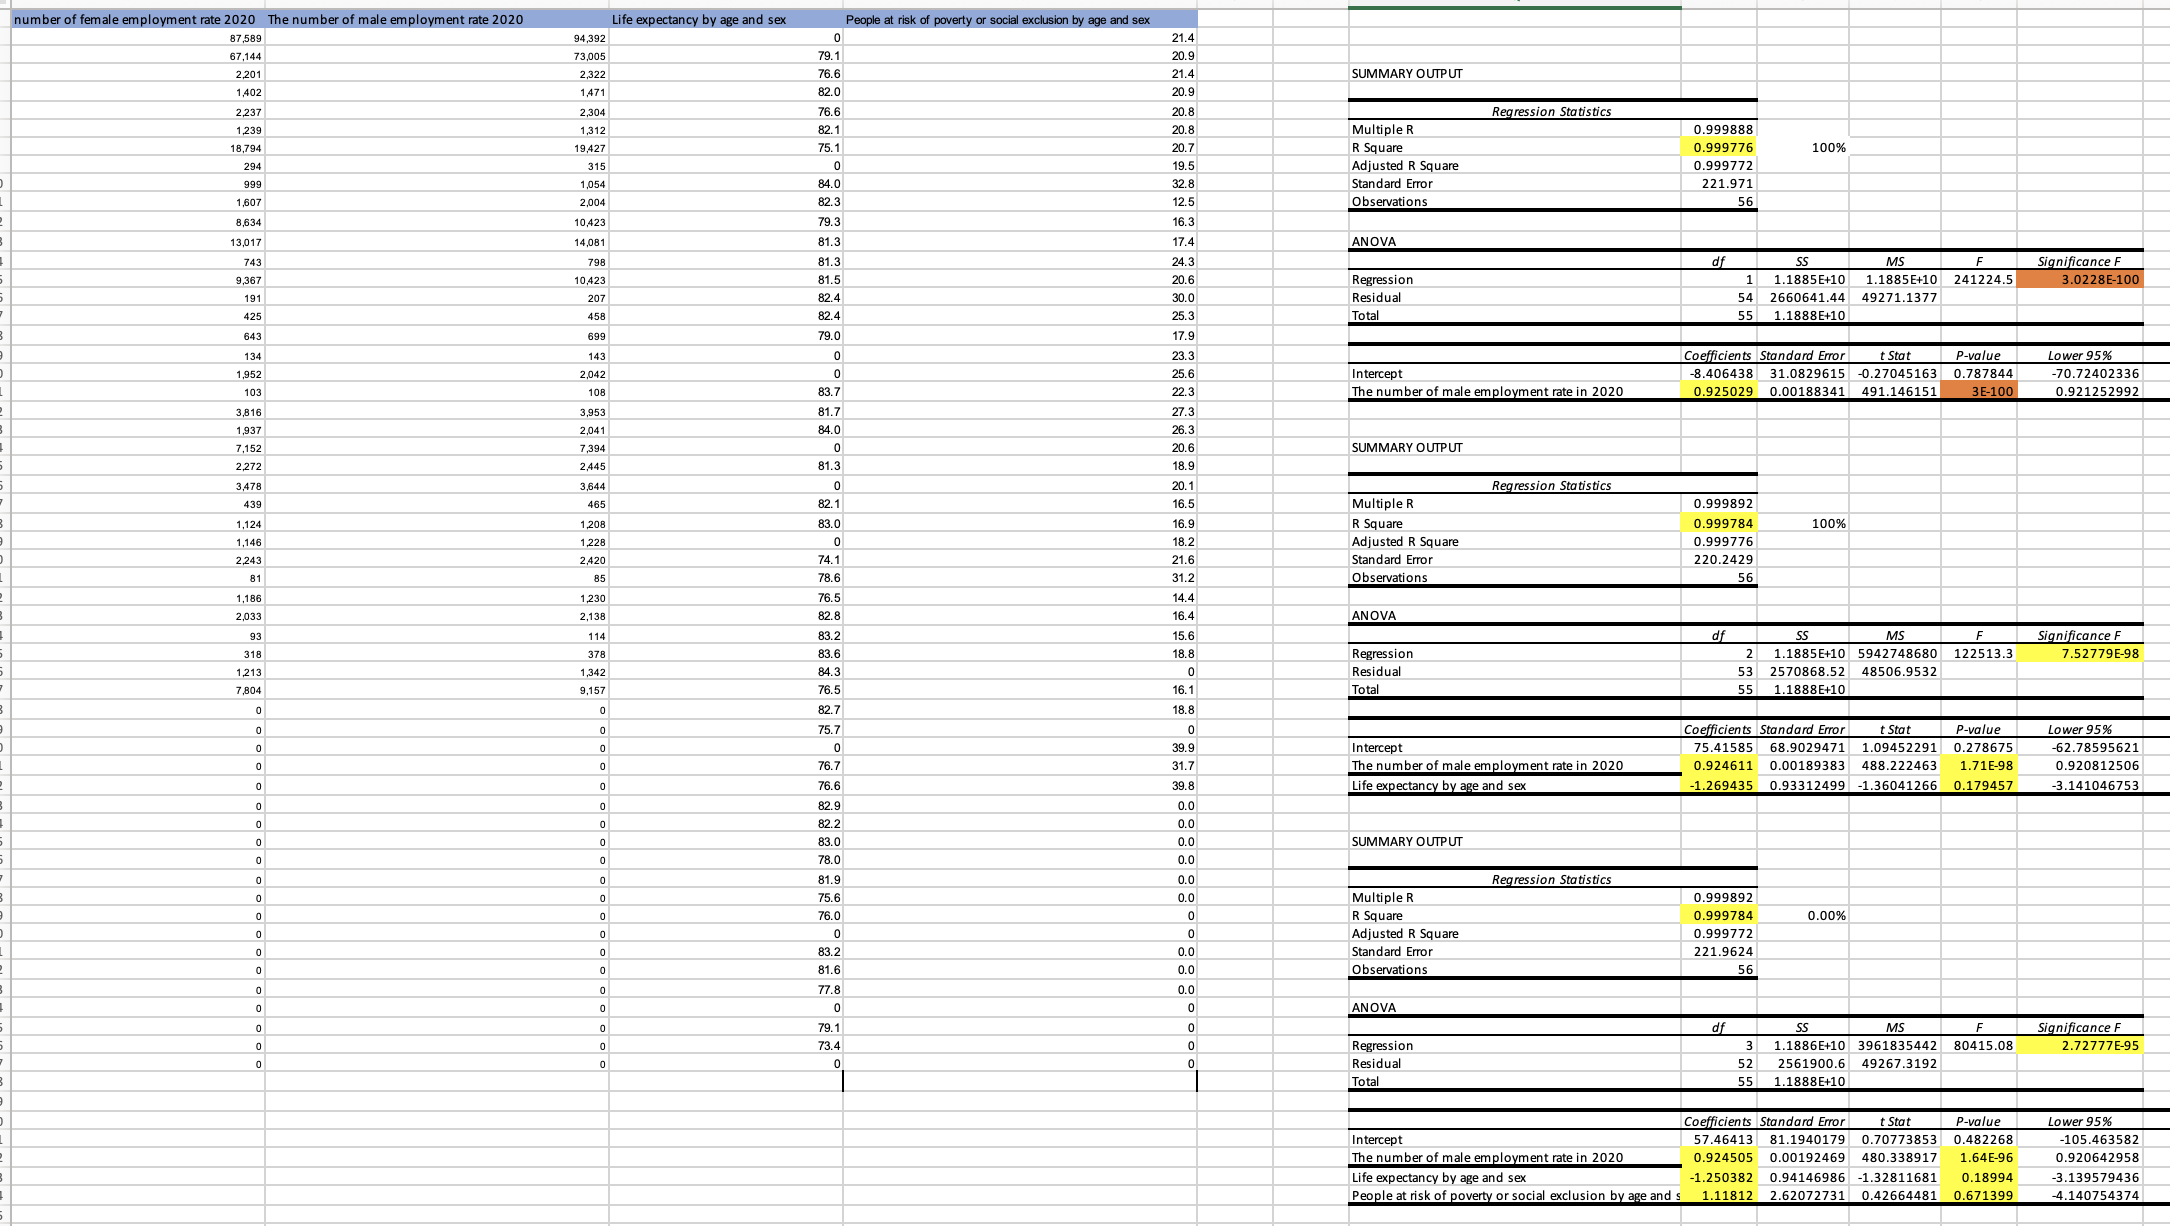
May you help me with these questions?
1. the statistical significance of all slope estimates (interpret p-values), and other regression statistics for all models presented, e.g., comparing R2values across models.
2.Adding at least one additional independent (control) variable and implementing multiple regression.
number of female employment rate 2020 The number of male employment rate 2020 Life expectancy by age and sex 87,589 People at risk of poverty or social exclusion by age and sex 14,392 0 67,144 3,005 21.4 79.1 2,201 20.9 2,322 76.6 1,402 21.4 1471 SUMMARY OUTPUT 82.0 20.9 2,237 2,304 76.6 1,239 20.8 312 Regression Statistic 82.1 18,794 20.8 19427 Multiple R 75.1 0.999888 294 315 20.7 R Square 0 0.999776 100% 999 19.5 1,054 Adjusted R Square 84.0 0.999772 1,607 2.8 2,004 Standard Error 32.3 221.971 8,634 12.5 Observations 56 10.423 79.3 13,017 6.3 14,081 81.3 17.4 743 798 ANOVA 81.3 ,367 24.3 10,423 81.5 df SS 191 20.6 207 Regression MS Significance F 82.4 30.0 1.18856+10 1.18856+10 241224.5 3.0228E-100 425 458 Residual B2.4 25.3 54 2660641.44 49271.1377 643 Total 699 55 79.0 1.1888E+10 134 17.9 143 o 1952 2,042 23.3 o 103 25.6 Coefficients Standard Error t Stat P-value Lower 95% 108 83.7 Intercept 22.3 -8.406438 31.0829615 -0.27045163 0.787844 The number of male employment rate in 2020 -70.72402336 3,816 3,953 81.7 0.925029 0.00188341 491.146151 3E-100 1,937 27.3 0.921252992 2,041 84.0 7,152 7,394 26.3 0 2,272 20.6 2.445 SUMMARY OUTPUT 81.3 18.9 3,478 3,644 0 439 465 20. 1 Regression Statistics 82.1 16.5 1,124 Multiple R 1,208 0.999892 83.0 1,146 16.9 1,228 O R Square 0.999784 100% 2,243 8.2 2,420 Adjusted R Square 74.1 0.999776 81 85 21.6 Standard Error 78.6 220.2429 31.2 1,186 1,230 Observations 56 76.5 2.033 14.4 2,138 82.8 16.4 93 114 ANOVA 83.2 318 15.6 378 of 83.6 SS 8.8 MS Significance F 1,213 1,342 84.3 Regression 0 1.18856+10 5942748680 122513.3 7.52779E-98 7,804 9,157 Residual 76.5 16.1 Total 2570868.52 48506.9532 0 55 82.7 1.1888E+10 18.8 0 75.7 0 o o Coefficients Standard Error o o 39.9 t Stat P-value Lower 95% Intercept 76.7 31.7 75.41585 68.9029471 1.09452291 0.278675 62.78595621 The number of male employment rate in 2020 76.6 39.8 0.924611 0.00189383 488.222463 1.71E-98 0.920812506 Life expectancy by age and sex B2.9 0.0 -1.269435 0.93312499 -1.36041266 0.179457 -3.141046753 82.2 0.0 83.0 0.0 SUMMARY OUTPUT 78.0 0.0 o o 31.9 0.0 Regression Statistics 75.6 Multiple R 6.0 0 0.999892 R Square 0 0.999784 0.00% 83.2 Adjusted R Square 0.999772 0.0 Standard Error 81.6 221.9624 0.0 Observations 17.8 56 0.0 0 o ANOVA 79.1 73.4 df SS MS ooo Regression Significance F 0 Residual 3 1.18865+10 3961835442 80415.08 2.72777E-95 52 2561900.6 49267.3192 Total 55 1.18886+10 Coefficients Standard Error t Stat P-value Lower 95% Intercept 57.46413 81.1940179 0.70773853 0.48226 -105.463582 The number of male employment rate in 2020 0.924505 0.00192469 480.338917 1.64E-96 0.920642958 Life expectancy by age and sex -1.250382 0.94146986 -1.32811681 0.18994 -3.139579436 People at risk of poverty or social exclusion by age and s 1.11812 2.62072731 0.42664481 0.671399 4.140754374


