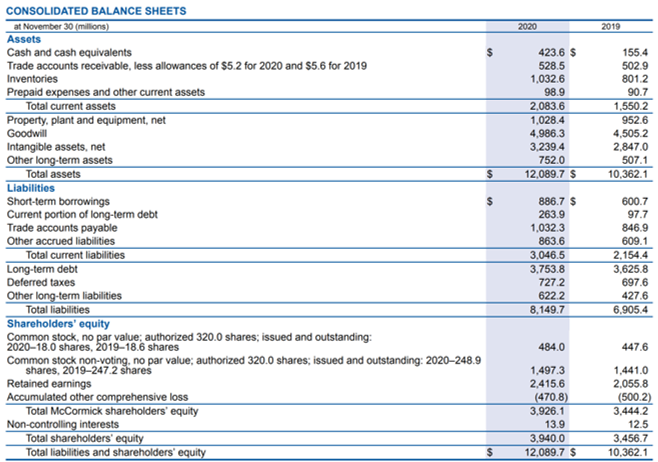
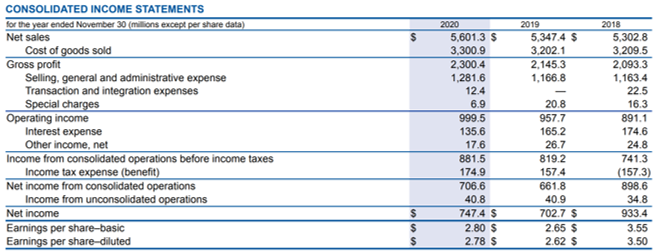
McCormick & Company, is an American multinational food company who manufactures, markets, and distributes spices to the food industry in 160 countries. With regards to its financial performance for the fiscal year 2019 and 2020 please conduct ratio analysis utilizing the following; Return on Equity, Return on assets and Earnings per share. please typed answers / explanations with own words. no graphs or visual aids


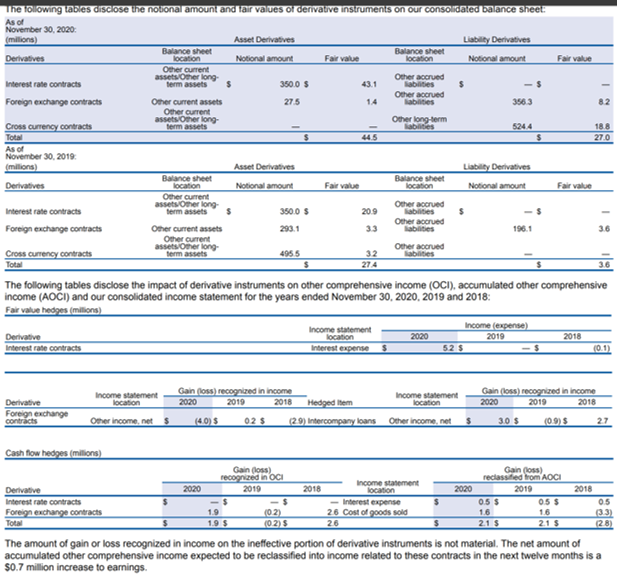
2020 2019 $ 423.6 $ 528.5 1.032.6 98.9 2,083.6 1,028.4 4.986.3 3.239.4 752.0 12,089.7 $ 155.4 5029 8012 90.7 1,5502 952.6 4,505.2 2,847.0 507.1 10,362.1 CONSOLIDATED BALANCE SHEETS at November 30 millions) Assets Cash and cash equivalents $ Trade accounts receivable, less allowances of $5.2 for 2020 and $5.6 for 2019 Inventories Prepaid expenses and other current assets Total current assets Property, plant and equipment, net Goodwill Intangible assets, net Other long-term assets Total assets $ Liabilities Short-term borrowings $ Current portion of long-term debt Trade accounts payable Other accrued liabilities Total current liabilities Long-term debt Deferred taxes Other long-term liabilities Total liabilities Shareholders' equity Common stock, no par value authorized 320.0 shares; issued and outstanding: 2020-18.0 shares, 2019-18.6 shares Common stock non-voting, no par value; authorized 320.0 shares; issued and outstanding: 2020-248.9 Retained earnings Accumulated other comprehensive loss Total McCormick shareholders' equity Non-controlling interests Total shareholders' equity Total liabilities and shareholders' equity $ 886.7 $ 263.9 1,032.3 863.6 3,046.5 3,753.8 727.2 6222 8.149.7 600.7 97.7 846.9 609.1 2.154.4 3.625.8 697.6 427.6 6.905.4 484.0 1,497.3 2.415.6 (470.8) 3,926.1 13.9 3.940.0 12.089.7 $ 447,6 1,441.0 2,055.8 (500.2) 3,444.2 12.5 3.456.7 10.362.1 $ 2019 5,347.4 $ 3.202.1 2.145.3 1,166.8 CONSOLIDATED INCOME STATEMENTS for the year ended November 30 (milions except per share data) Net sales Cost of goods sold Gross profit Selling, general and administrative expense Transaction and integration expenses Special charges Operating income Interest expense Other income, net Income from consolidated operations before income taxes Income tax expense (benefit) Net income from consolidated operations Income from unconsolidated operations Net income Earnings per share-basic Earnings per share-diluted 2020 5,601.3 $ 3,300.9 2,300.4 1.281.6 12.4 6.9 999.5 135.6 17.6 881.5 174.9 706.6 40.8 747.4 $ 2.80 $ 2.78 $ 20.8 957.7 165.2 26.7 819.2 157.4 661.8 40.9 702.7 $ 2.65 $ 2.62 $ 2018 5,302.8 3.209.5 2.093.3 1.163.4 22.5 16.3 891.1 174.6 24.8 741.3 (157.3) 898.6 34.8 933.4 3.55 3.50 $ $ $ 1 The following tables disclose the notional amount and fair values of derivative instruments on our consolidated balance sheet: As of November 30, 2020 (millions) Asset Derivatives Liability Derivatives Balance sheet Balance sheet Derivatives location Notional amount Fair value location Notional amount Fair value Other current assets Other long Other accrued Interest rate contracts term assets $ 350,0 sabilities $ Other accrued Foreign exchange contracts Other current assets 275 1.4 Babies 3563 82 Other current assets Other long Other long-term Cross currency contracts term assets Kabites 5244 188 Total 44.5 $ 27.0 As of November 30, 2019 milions) Asset Derivatives Liability Derivatives Balance sheet Balance sheet Derivatives location Notional amount Fair value location Notional amount Fair value Other current assets Other long Other accrued Interest rate contracts term assets $ 350.0 $ 20.9 abilities $ $ Other accrued Foreign exchange contracts Other current assets 293.1 3.3 kabites 196.1 3.6 Other current assets Other long Other accrued Cross currency contracts term assets 4955 32 Total 274 36 The following tables disclose the impact of derivative instruments on other comprehensive income (OCI), accumulated other comprehensive income (AOCI) and our consolidated income statement for the years ended November 30, 2020, 2019 and 2018: Fair value hedges (milions) Income (expense) Derivative Income statement location 2020 2019 2018 Interest rate contracts Interest expense $ 52 $ (0.1) Derivative Foreign exchange contracts Income statement location Other income, net 5 Gain loss) recognized in income Income statement Gain (los) recognized in income 2020 2019 2018 Hedgedlem location 2020 2019 2018 (40S 02 $ (29) Intercompany loans Other income, net s 3.0 $ (0.95 27 05 Cash flow hedges (millions) Gain (loss) Gain (los) recognized in oci reclassified from AOCI Derivative 2020 2019 2018 Income statement location 2020 2019 2018 Interest rate contracts -$ $ Interest expense 0.5 $ 0.5 $ Foreign exchange contracts 19 26 Cost of goods sold 3.3) Total S 1.9 $ (025 26 21 $ 215 The amount of gain or loss recognized in income on the ineffective portion of derivative instruments is not material. The net amount of accumulated other comprehensive income expected to be reclassified into income related to these contracts in the next twelve months is a $0.7 million increase to earnings. (02) (28) 2020 2019 $ 423.6 $ 528.5 1.032.6 98.9 2,083.6 1,028.4 4.986.3 3.239.4 752.0 12,089.7 $ 155.4 5029 8012 90.7 1,5502 952.6 4,505.2 2,847.0 507.1 10,362.1 CONSOLIDATED BALANCE SHEETS at November 30 millions) Assets Cash and cash equivalents $ Trade accounts receivable, less allowances of $5.2 for 2020 and $5.6 for 2019 Inventories Prepaid expenses and other current assets Total current assets Property, plant and equipment, net Goodwill Intangible assets, net Other long-term assets Total assets $ Liabilities Short-term borrowings $ Current portion of long-term debt Trade accounts payable Other accrued liabilities Total current liabilities Long-term debt Deferred taxes Other long-term liabilities Total liabilities Shareholders' equity Common stock, no par value authorized 320.0 shares; issued and outstanding: 2020-18.0 shares, 2019-18.6 shares Common stock non-voting, no par value; authorized 320.0 shares; issued and outstanding: 2020-248.9 Retained earnings Accumulated other comprehensive loss Total McCormick shareholders' equity Non-controlling interests Total shareholders' equity Total liabilities and shareholders' equity $ 886.7 $ 263.9 1,032.3 863.6 3,046.5 3,753.8 727.2 6222 8.149.7 600.7 97.7 846.9 609.1 2.154.4 3.625.8 697.6 427.6 6.905.4 484.0 1,497.3 2.415.6 (470.8) 3,926.1 13.9 3.940.0 12.089.7 $ 447,6 1,441.0 2,055.8 (500.2) 3,444.2 12.5 3.456.7 10.362.1 $ 2019 5,347.4 $ 3.202.1 2.145.3 1,166.8 CONSOLIDATED INCOME STATEMENTS for the year ended November 30 (milions except per share data) Net sales Cost of goods sold Gross profit Selling, general and administrative expense Transaction and integration expenses Special charges Operating income Interest expense Other income, net Income from consolidated operations before income taxes Income tax expense (benefit) Net income from consolidated operations Income from unconsolidated operations Net income Earnings per share-basic Earnings per share-diluted 2020 5,601.3 $ 3,300.9 2,300.4 1.281.6 12.4 6.9 999.5 135.6 17.6 881.5 174.9 706.6 40.8 747.4 $ 2.80 $ 2.78 $ 20.8 957.7 165.2 26.7 819.2 157.4 661.8 40.9 702.7 $ 2.65 $ 2.62 $ 2018 5,302.8 3.209.5 2.093.3 1.163.4 22.5 16.3 891.1 174.6 24.8 741.3 (157.3) 898.6 34.8 933.4 3.55 3.50 $ $ $ 1 The following tables disclose the notional amount and fair values of derivative instruments on our consolidated balance sheet: As of November 30, 2020 (millions) Asset Derivatives Liability Derivatives Balance sheet Balance sheet Derivatives location Notional amount Fair value location Notional amount Fair value Other current assets Other long Other accrued Interest rate contracts term assets $ 350,0 sabilities $ Other accrued Foreign exchange contracts Other current assets 275 1.4 Babies 3563 82 Other current assets Other long Other long-term Cross currency contracts term assets Kabites 5244 188 Total 44.5 $ 27.0 As of November 30, 2019 milions) Asset Derivatives Liability Derivatives Balance sheet Balance sheet Derivatives location Notional amount Fair value location Notional amount Fair value Other current assets Other long Other accrued Interest rate contracts term assets $ 350.0 $ 20.9 abilities $ $ Other accrued Foreign exchange contracts Other current assets 293.1 3.3 kabites 196.1 3.6 Other current assets Other long Other accrued Cross currency contracts term assets 4955 32 Total 274 36 The following tables disclose the impact of derivative instruments on other comprehensive income (OCI), accumulated other comprehensive income (AOCI) and our consolidated income statement for the years ended November 30, 2020, 2019 and 2018: Fair value hedges (milions) Income (expense) Derivative Income statement location 2020 2019 2018 Interest rate contracts Interest expense $ 52 $ (0.1) Derivative Foreign exchange contracts Income statement location Other income, net 5 Gain loss) recognized in income Income statement Gain (los) recognized in income 2020 2019 2018 Hedgedlem location 2020 2019 2018 (40S 02 $ (29) Intercompany loans Other income, net s 3.0 $ (0.95 27 05 Cash flow hedges (millions) Gain (loss) Gain (los) recognized in oci reclassified from AOCI Derivative 2020 2019 2018 Income statement location 2020 2019 2018 Interest rate contracts -$ $ Interest expense 0.5 $ 0.5 $ Foreign exchange contracts 19 26 Cost of goods sold 3.3) Total S 1.9 $ (025 26 21 $ 215 The amount of gain or loss recognized in income on the ineffective portion of derivative instruments is not material. The net amount of accumulated other comprehensive income expected to be reclassified into income related to these contracts in the next twelve months is a $0.7 million increase to earnings. (02) (28)


